Teaching the Whys of Where: Enhancing Understanding Through Geography
Published by: WCET | 3/1/2016
Tags: Data And Analytics, Faculty, Innovation, Instructional Design, STEM, Teaching, Technology
Published by: WCET | 3/1/2016
Tags: Data And Analytics, Faculty, Innovation, Instructional Design, STEM, Teaching, Technology
Thank you to Allison Friederichs (Associate Dean for Academic Affairs, Assistant Teaching Professor, University College \ University of Denver) for recommending an innovative adjunct faculty member for today’s guest blog post. I think you will enjoy learning from Joseph Kerski. Thank you Joseph for sharing your experiences. — Russ Poulin, WCET.
Think about major societal issues that we are asking students to understand in higher education, and grapple with and solve in the 21st Century workplace. What issues come to your mind? In my discussions with students, we typically generate a list that includes water quality and quantity, climate, human health, food security, biodiversity loss, sustainable agriculture and tourism, energy, natural hazards, political instability, transportation, education, population change, and economic viability.
But no matter what the final list includes, the point I then make is that all of the major issues of our time are related to geography. Not only do they all occur somewhere, but the issues have specific geographic patterns, linkages, relationships, and trends. In short, they can all be better understood through the spatial, or geographic, perspective.
This perspective is important to teach not only in sciences related to earth and environmental studies, such as biology, geology, anthropology, and geography, but in history, language arts, mathematics, engineering, planning, criminal justice, medical sciences, business, and many others. As the above issues grow in importance on a global scale, they also increasingly affect our everyday lives. To grapple with these issues requires graduates that have a firm foundation in spatial thinking, skills, and foundations; those who can see the “big picture” but that understand how different patterns and trends are related from a global scale down to the local community.
Advancing from Folded Maps to a Modern Geographic Information System
To understand these patterns and trends requires the ability to map data within a geographic information system (GIS) environment. Far from being musty paper documents tucked away in a back corner of the classroom or workplace, maps are more relevant to education and society than ever. Today’s maps and tools are in digital form running in the data cloud in a “software as a service” mode, much like Google or Microsoft online documents, Dropbox, music services such as Pandora, and business solutions such as salesforce.com.
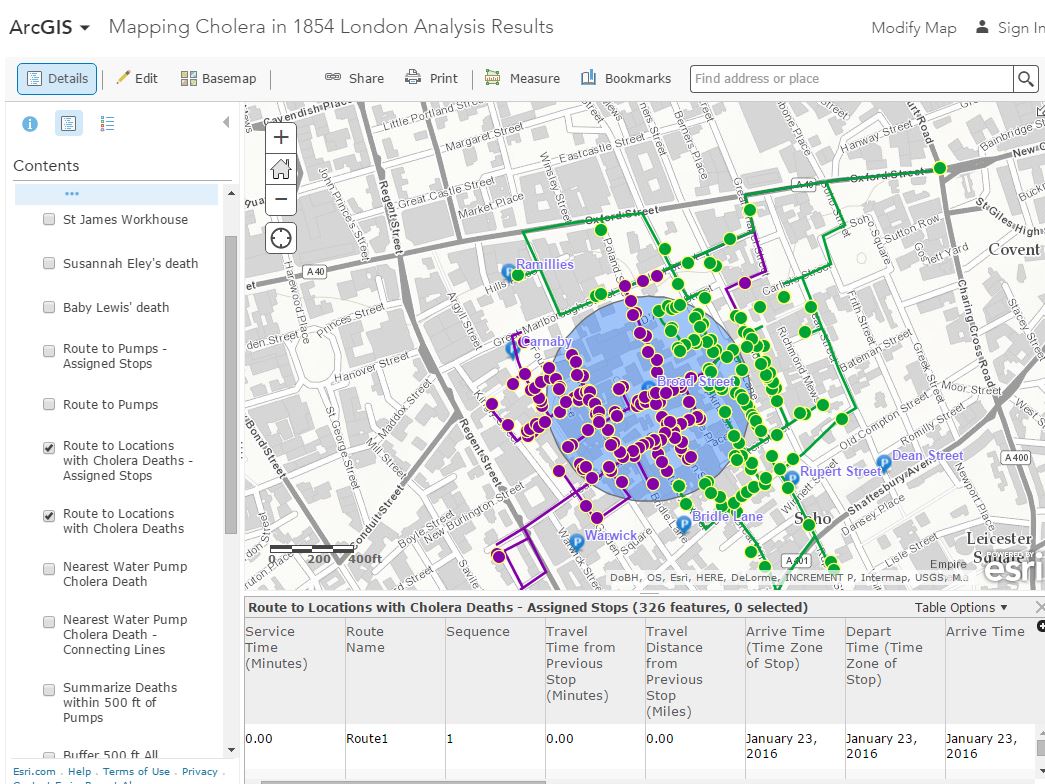
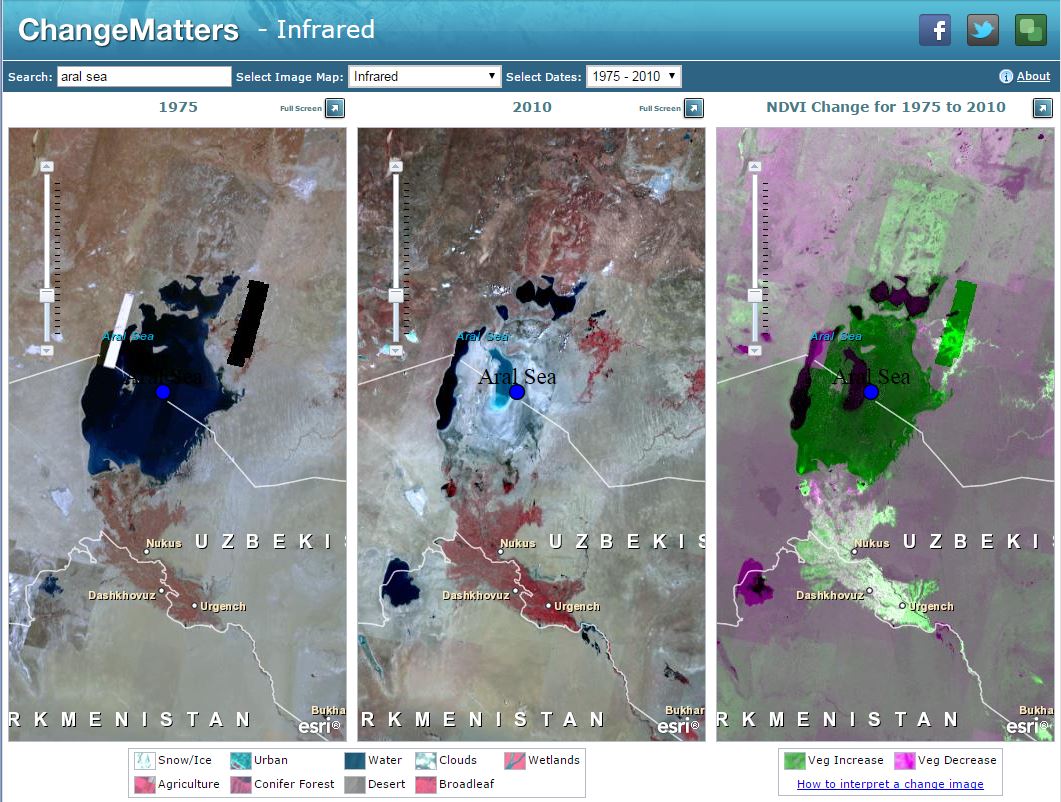
Data can be mapped in 2D and 3D, and these maps now allow real-time data to be mapped, such as wildfires and other natural hazards, as well as posts to social media. These maps can be used in the field and in the laboratory; they are not static; they can be modified. They can be contributed to via crowdsourcing methods with an ordinary smartphone. They allow for quantitative and qualitative spatial analysis, such as for proximity studies, routing, map overlay, georeferencing, and geocoding. They are used daily for more efficient decision making in an increasing number of professions in the 21st Century.
How Do Mapping Tools Fit Into My Courses?
In my online and face-to-face courses while serving as Instructor at the University of Denver, for a variety of other universities, and while serving as Education Manager for Esri (Environmental Systems Research Institute), I ask the students to grapple with such questions as: What is the relationship between birth rate, quality of human health, and life expectancy? How does acid mine drainage in a mountain range affect water quality downstream? How will climate change affect global food production? What is the ideal location for a specific type of business given the traffic pattern, demographic characteristics, competitors’ locations, zoning, and property values of a specific community?
Geographic questions begin with the “whys of where”. Why are cities, ecoregions, earthquakes, businesses, and other objects located where they are? How are they affected by their proximity to nearby things, and by invisible global interconnections and networks? Teaching with web mapping is an inherently inquiry-driven activity: Asking deep and relevant questions is the first part of scientific inquiry. It forms the basis for knowing what types of data to collect, to analyze, and what decisions to make.
Helping Students to Ask the Right Questions…
The maps do not ask the questions. Rather, it is the student with an instructor’s guidance, developing a firm foundation in understanding historical issues, who can ask these questions. After asking geographic questions, students acquire geographic resources and collect data, such as maps, satellite imagery, spreadsheets, and data. These data sets are increasingly from rich online libraries and from their own fieldwork. By analyzing these data, they discover relationships across time and space.
These investigations involve critical thinking, increasingly important in the new era of crowdsourced geographic information. Not only are agencies such as the World Health Organization, the US Geological Survey, and one’s own local government generating data, but ordinary citizens are increasingly gathering and mapping data.
Geographic investigations can be used to cultivate critical thinking skills, helping students to understand the benefits but also the limitations of data, and how to deal with uncertainty. Geographic investigations also involve systems thinking, whether the system contains the components of mass transit in a specific urban area, the interconnections between biomes, soil type, and landforms, or the interaction between weather and oceans.
…And Search for Answers That Lead to Additional Questions.
Geographic investigations are often value-laden and examining a problem from all sides. For example, after examining a map of cotton production in the USA, students investigate the relationship between altitude, latitude, climate, and cotton production. They ask, “Why is cotton grown in this area?” After discovering that much cotton is grown in dry regions that must be irrigated, they can ask, “Should cotton be grown in this area? Is this the best use of water and other natural resources?” Finally, students present the results of their investigations using geographic tools such as Geographic Information Systems (GIS) and multimedia. Their investigations usually spark additional questions, and the cycle that results is the essence of geographic inquiry.
How Can You Add Spatial Thinking to Your Course?
How can instructors foster spatial thinking in their courses? As part of my interest in helping those outside the university walls to understand why all of this is important, at the University of Denver I recently taught a course entitled “Why Maps Still Matter” for the general public. For this course, but also for many of my university courses, I focus on hands-on problem-based learning. The problems included selecting the ideal locations for tea cultivation in Kenya, assessing the most vulnerable populations and areas to flooding in Boulder Colorado, and studying the spread of bird flu across Eurasia for a 12 year period.
To solve the problems, students use data, images, maps, and tools in a hands-on, investigative mode, such as the following:
Maps…Not Just for Geography Classes Anymore
Examining issues through a GIS environment adheres to the core tenets of the Partnership for 21st Century Learning. GIS is one of the three fastest growing technology skill sets as identified by the US Department of Labor. Web GIS, in particular, is rapidly being adopted by government agencies, nonprofit organizations, and private industry.
Cultivating these skills builds personal effectiveness competencies (Are you organized? Are you ethical?), the ability to deal with and grapple with an increasing volume and variety of data, and other skills identified by a community college NSF-funded project resulting in the Geospatial Technology Competency Model. Students engaged with these technologies and approaches will be better able to use data at a variety of scales and in a variety of contexts, to think systematically and holistically, and to use quantitative and qualitative approaches to solve problems.
In short, as students and then as graduates, they will be better decision makers. The geographic perspective underpins the critical thinking skills, technology skills, citizenship skills, and life skills that underpin virtually all other disciplines. It is too important to confine simply to geography itself. Rather, it is essential for enabling students to grapple with the essential issues of the 21st Century.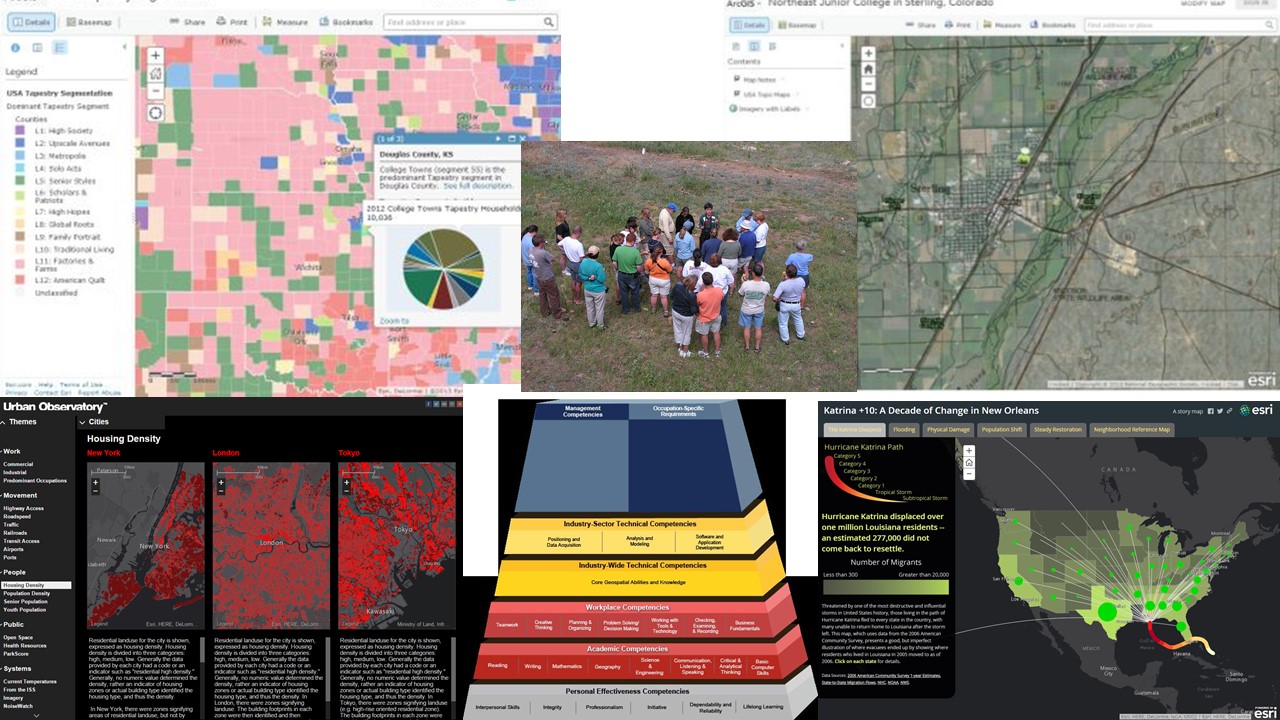
Tools, maps, and approaches fostered by the use of dynamic web maps and the geographic perspective in education. For more information, see my web page, my video channel, the Spatial Reserves blog, and the GIS Education Community blog. 
Joseph J. Kerski, Ph.D., GISP
Education Manager
Esri – Environmental Systems Research Institute
jkerski@esri.com
Twitter: http://twitter.com/josephkerski
1 reply on “Teaching the Whys of Where: Enhancing Understanding Through Geography”
Excellent article about the power of geography! It opened my eyes to the possibilities of it!