There is new improvement to the U.S. Department of Education’s Graduation Rate statistic. And we should all be using it.
Institutions with large non-traditional student enrollments (e.g.: community colleges, online colleges, inner city universities, military-serving institutions) have not been well-represented by the Department’s Graduation Rate statistic. Few of their students are included in the results because only first-time, full-time enrollees are included in the process used to calculate the Graduation Rate.
 Since 2008 the Integrated Postsecondary Education Data System (IPEDS) has collected data on a new metric to solve that problem – the Outcome Measures. Last year they released the first results, but there has been less news about it than we hoped.
Institutions that serve a large number of non-traditional students need to be using Outcome Measures. Today the Western Interstate Commission for Higher Education (WICHE) Policy and Research unit released a great analysis of this new statistic and they calculated the impact across the western states today. This blog post is the first in a series where we provide observations and suggestions on how you can use Outcome Measures to better understand the outcomes of students at your own institution.
What Are the Outcome Measures?
For the Graduation Rate measure, which until recently had been the only available measure, institutions are asked to identify a “cohort” of students who enter as first-time (they’ve not attended college before) and full-time (they are taking a full load of courses) in the fall of a given academic year. Institutions track and report what happened to those students after a set number of years depending on the type of degree they are pursuing.
The new Outcome Measures asks institutions to expand this tracking by adding three additional cohort categories of students:
- First-time, full-time (similar to the Graduation Rate)
- First-time, part-time
- Non-first-time (transfer-in), full-time
- Non-first-time (transfer-in), part-time
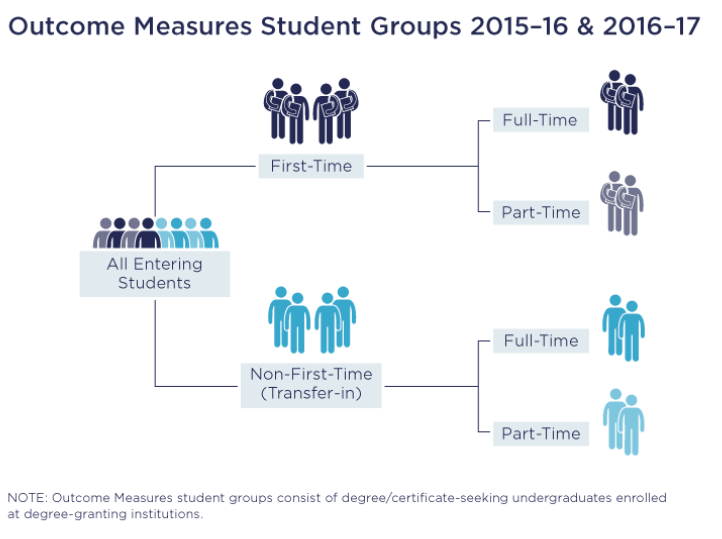
Source: https://nces.ed.gov/ipeds/use-the-data/survey-components/outcome-measures
The first cohorts were compiled for the Fall 2008 academic term and the first dataset containing results was released last October. Inside Higher Ed reported on the release and Robert Kelchen (higher education policy and data expert) provided some initial analysis.
Important Findings from the WICHE Policy Work
We started playing with these analyses a few months ago and learned that our friends down the hall in WICHE Policy and Research were doing the same thing. We were able to share what we learned and discovered that we were doing complementary analyses. Peace Bransberger and Colleen Falkenstern of WICHE Policy created a wonderful WICHE Insights brief, focused on state and regional analyses (only in the Western states) of the new data. Meanwhile, we at WCET, also a unit of WICHE, are focusing on the impact at the institutional level and how institutional personnel might use and display the data.
Many More Students are Counted
The WICHE Policy brief (released today) produced great findings for the WICHE region:
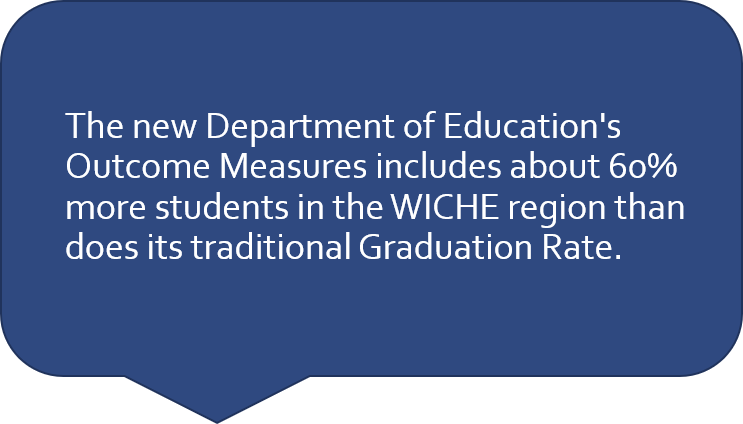
- Outcome Measures data provide information for about 60% more 2008-09 undergraduates in the WICHE region than covered by the IPEDS Graduation Rate data. This breaks down as:
- 39% more students at four-year institutions
- 71% more students at two-year institutions
Wow! Sixty percent of all western students were not included in the Graduation Rate. That strikes us as a large percentage. Institutions were not recognized for their results…good or bad.
Surprising Results on Completion Rates for the Newly Counted Students
In looking at the graduation results for “non-first-time” (transfer-in) students, there were some surprising results in calculations across the WICHE states:
“And overall, non-first-time undergraduates completed a credential within six years at higher rates than first-time students. The rate (72 percent) at which non-first-time, full-time students completed a credential within six years exceeded that rate (59 percent) for their first-time peers by 13 percentage points. And the rate for non-first-time, part-time students (52 percent) was 28 percentage points higher than for their first-time peers (24 percent).”
Students in the “non-first-time” (or transfer-in) group completed a credential within six years at a higher rate than the more traditional first-time, full-time students. But, before now they were not even counted.
Peace and Colleen also provide a great caveat for us when talking about this data:
“There are important distinctions between the credential rate from Outcome Measures data and the Graduation Rate data…Users should clearly distinguish between these data as they are not synonymous.”
Great work by Peace and Colleen. We recommend you read their brief, even if you are not from the West.
Why Should I Care?
This is a great advance for institutions that serve non-traditional students, as many of their students may be enrolled for only a few courses and/or may have attended another college or university. Many students simply were not included in the Graduation Rate.
To show the impact, let’s look at some concrete examples of institutions with a focus on non-traditional students. From the Outcome Measures that were released last Fall, here are percentage of students who were listed as first-time, full-time from their Fall 2008 cohort:
- A few Colorado universities:
- Metropolitan State University of Denver – 41%
- University of Colorado, Colorado Springs – 56%
- University of Colorado, Denver/Anschutz Medical Campus – 42%
- A few Colorado community colleges:
- Community College of Denver – 22%
- Front Range Community College – 27%
- Pueblo Community College – 27%
- A few institutions with large online enrollments:
- Capella University – 0.9%
- University of Maryland-University College – 2.5%
- Western Governors University – 7.0%
Remember that these were the only students counted in the previous IPEDS Graduation Rate calculations. Therefore, their graduation results were based on a fraction of the students attending the institution. As an analogy…if we declared the Super Bowl winner before halftime, the Atlanta Falcons would own the 2017 trophy instead of the New England Patriots.
A Real Example of the Problem
The press, policymakers, and college ranking services like to use the IPEDS Graduation Rate as a simple, independent indicator of the results of students attending college. For example, here is an alarming warning about University of Maryland-University College on an Education Trust website:
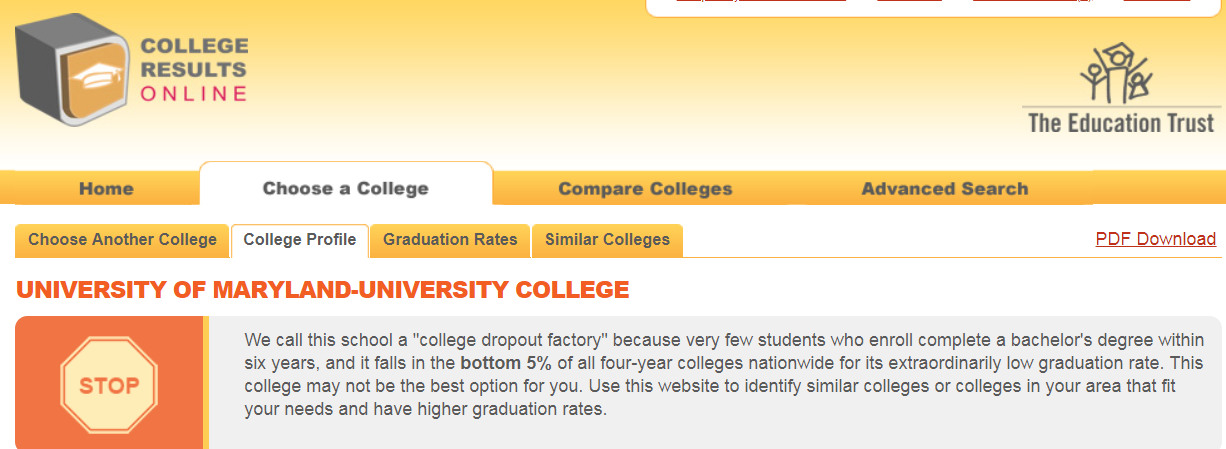
If you were a potential student or a parent of a student who is shopping for a college, what would you think?
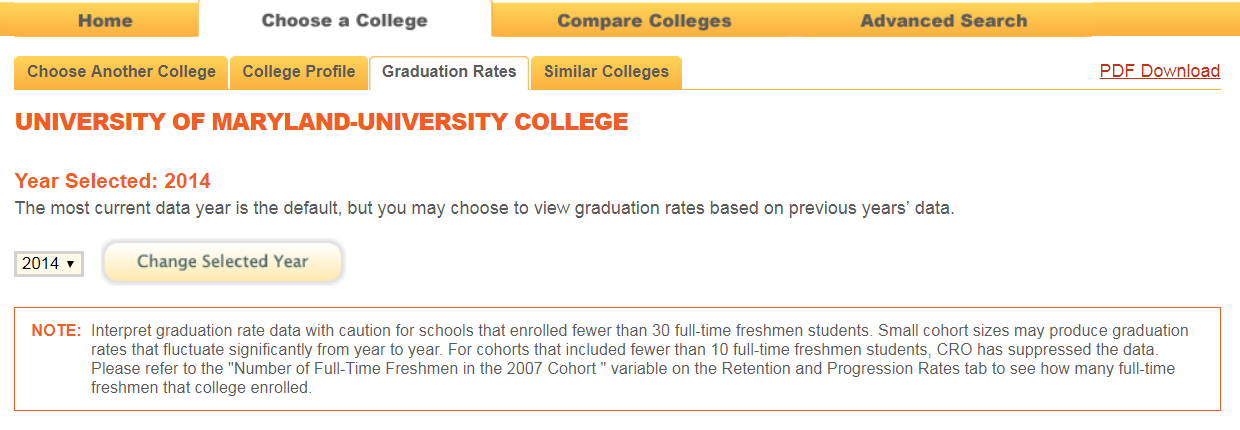
The site provides no context that this is warning is based on only 2.5% of the students in the University’s freshman class. If you go to the graduation rates tab, you find a “NOTE:” in which there is an attempt to give caution for low numbers of “full-time freshmen students,” but it would be a very exceptional student or parent to be able to make any sense of that caution.
What is a student to think? Or a lawmaker? Or anyone else?
To make matters worse, the instructions are incomplete. It took us awhile to find the “Retention and Progression Rates” tab mentioned in the “Note.” We discovered (through trial and error) that you need to first select the “Similar Colleges” tab. You can then find the “Retention and Progression and Rates” tab. There you find there were 107 full-time students in the 2008 cohort. So, their warning is based upon 107 students out of 35,154 total enrollment that they report on the initial page for the institution. The “30-student caution” that they give is simply too low for larger institutions.
About Education Trust…they do good work and have the correct goals in mind as they proclaim themselves as: “Fierce advocates for the high academic achievement of all students – particularly those of color or living in poverty.” Kudos. Keep it up. This is just one place in which you can better serve those students. And it is not your fault that better data were not available previously.
And What About the Student Achievement Measure?
There is a similar, independent effort to attack the problem with Graduation Rate undercounts. The Student Achievement Measure (SAM): “provides a comprehensive picture of student progress on their path to earning a college degree or certificate. As compared to the limitations of typical graduation rate measures, SAM reports more outcomes for more students”
SAM does wonderful work and we support what they do. According to their website (as of this posting) they have 632 participating institutions. While there may be some limitations or growing pains with the IPEDS Outcome Measures, the great advantage is that all institutions offering federal financial aid are required to participate in the IPEDS surveys.
The Bottom Line…and Upcoming Posts
The IPEDS Graduation Rate simply does not represent the reality of what happens at institutions serving a significant number of non-traditional institutions. IPEDS has given us a good new statistic, but we’ve noticed little uptake in using it.
We need to change this. We need to get involved!
In future blog posts, we will look at some outcomes for a few community colleges, universities, and non-profits. Some institutions show better results with the Outcome Measures, others do not. We’ll also suggest a start for you to calculate and display the data for your institution. We thank Peace and Colleen from WICHE Policy for their great help with our thinking on data displays.
Meanwhile, some questions for you…
- Is your institution well-represented by the Graduation Rates and/or Outcome Measures data?
- How can we more people across your institution to know about and use the Outcome Measures?
- What else should we ask about the Outcome Measures?
Let’s promote better data.

Russell Poulin
Director, Policy & Analysis
WCET – The WICHE Cooperative for Educational Technologies
rpoulin@wiche.edu | @russpoulin

Terri Taylor-Straut
Director of Actualization
ActionLeadershipGroup.com

3 replies on “Count All Students! New Outcome Measures Now Include Non-Traditional Students”
In your examples from Colorado institutions, those number that reflect the portion of the new 2008 Outcome Measures are astonishing, and, in most cases, could be interpreted by the first quarter or even the first play of the superbowl!
I think it would be interesting to see a table of those same example institutions comparing that FTFT graduation rate with the Outcome Measures rate. Thanks!
[…] « Count All Students! New Outcome Measures Now Include Non-Traditional Students […]
[…] first post in our series introduced the issue generally and the second examined the Outcome Measures results for […]