Should we count all students when analyzing higher education, or only some of them? It’s not surprising that when you include all students, you get different results from that analysis than when you don’t. We think all students should be included.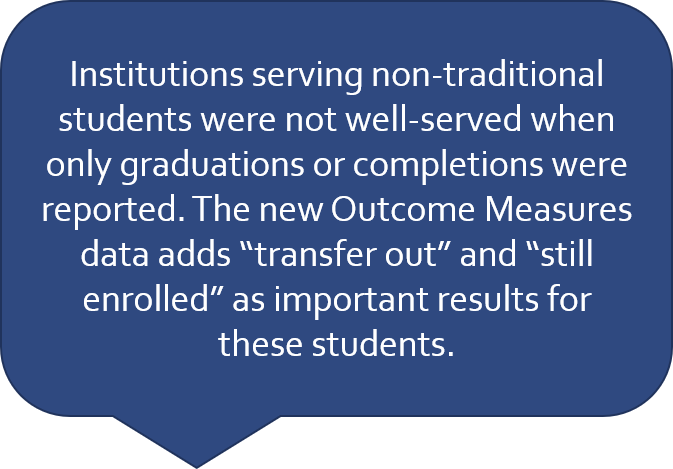
As reported in our last blog post (“Count All Students! New Outcome Measures Now Include Non-Traditional Students”), the U.S. Department of Education released data for a new Outcome Measures statistic last year. We thought that the Outcome Measures would provide more comprehensive data regarding student outcomes than the traditional Graduation Rate measure, which includes only first-time, full-time students. We were not disappointed.
Some overall observations:
- Our friends from the WICHE Policy and Research unit found that 60% of all higher education students and 71% of community college students were not included in the Department’s Graduation Rate statistic that has been used for many years.
- This is the first year for the data to be released. As with any new statistic, some institutions were more successful than others in gathering and reporting the data. This should improve in the coming years.
- Institutions with large non-traditional student enrollments (e.g.: community colleges, online colleges, inner city universities, military-serving institutions) have long clamored for a statistic that better represented the populations they serve. The addition of “transferred out” and “still enrolled” are important new options to show the student’s progress at the institution. For the institutions analyzed:
- For some, their Outcome Measures results are much better than what might be reported in their Graduation Rate.
- For others…not so much. It will be interesting to see if better data collection improves their results in the coming years.
- Based upon feedback from institutions to the Department, there are already some changes to data collections for future years.
In this post and the next, we will examine the Outcome Measures results for different sample sets of institutions. We will also provide you with our spreadsheet so that you can analyze the data and perform similar analyses for your institution.
What Are the Outcome Measures?
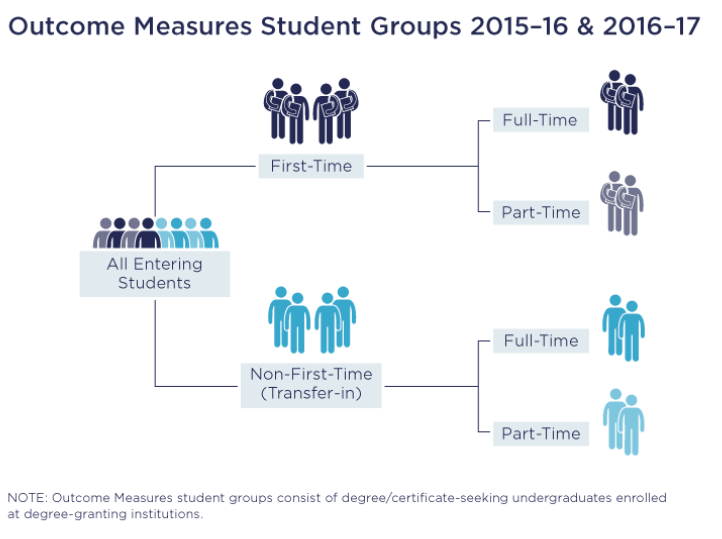
For the old Graduation Rate measure, institutions were asked to identify a “cohort” of students who entered as first-time (they’ve not attended college before) and full-time (they are taking a full load of courses) in the fall of a given academic year. Institutions track and report what happened to those students after a set number of years.
The new Outcome Measures asks institutions to expand this tracking by adding three additional cohort categories of students:
- First-time, full-time (similar to the Graduation Rate).
- First-time, part-time.
- Non-first-time (transfer-in), full-time.
- Non-first-time (transfer-in), part-time.
Source: https://nces.ed.gov/ipeds/use-the-data/survey-components/outcome-measures
The first cohorts were compiled for the Fall 2008 academic term and the first dataset containing results was released last October.
Top 15 Institutions Offering “Exclusively Distance Education Courses”
In examining the results more closely, the data related to student matriculation and outcomes vary dramatically, based on the mission of the institution. This is especially clear when we look at institutions that are known to serve large populations of students taking “exclusively distance education courses.”
With U.S. Department of Education’s Integrated Postsecondary Education Data System (IPEDS) data, it is possible to identify the institutions with the largest distance education enrollments. Enrollment data is collected separately from Outcome Measures, and we have reported on distance education enrollments several times over the past few years.
Using the 2016 IPEDS distance education enrollment data (the most recent available), we determined the top 15 institutions, based on reported number of enrollments taking exclusively distance education courses. These institutions, in order of exclusive distance education enrollment (largest to smallest), include:
- University of Phoenix-Arizona.
- Western Governors University.
- Southern New Hampshire University.
- Liberty University.
- Grand Canyon University.
- Walden University.
- American Public University System.
- University of Maryland-University College.
- Excelsior College.
- Ashford University.
- Capella University.
- Kaplan University-Davenport Campus.
- Brigham Young University-Idaho.
- Arizona State University-Skysong. (Note: Arizona State University has recently begun reporting some of its enrollments under this name even though it is not a separately accredited institution. Since the Outcomes Measures data that we analyzed reports students first enrolled in Fall 2008, there is no data to report for Skysong students.)
- Colorado Technical University-Colorado Springs.
That list includes eight for-profit, five non-profit, and two public institutions. Why this group? We were searching for a group of non-traditional institutions and this seemed better than any bias resulting from picking a set of institutions on our own. In our next blog post, we will examine public community colleges and universities in one state.
We compiled a complete Excel file of the 15 institutions and their reported data for each cohort. In the analysis below we provide graphic examples of the highs and/or lows for the category in question.
The Incoming Students: Composition of Fall 2008 Cohort
One of the benefits of Outcome Measures (OM) is to better understand the composition of the student cohorts at our institutions. While the IPEDS Graduation Rate includes only first-time, full-time students, Outcome Measures includes the four cohorts listed above. Let’s look at results for those institutions for each of the four cohorts…
First-time, full-time cohort
Predictably, the reported number of students in each of these four categories is aligned with the mission of the organizations. For example, the largest number of first-time, full-time students among the 15 organizations are BYU-Idaho with 76.7% and Southern New Hampshire University with 67.3%. These institutions both have large on-campus students populations in addition to their online presence. The Outcome Measures represent overall institutional enrollments; therefore, these data combine on-campus and online enrollment.
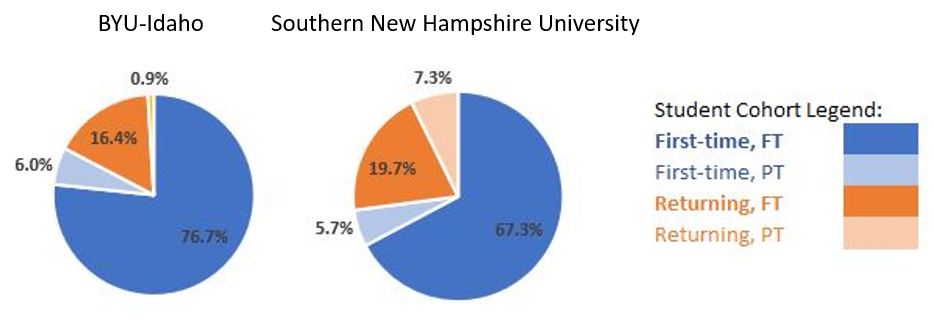
Institutions long-focused on serving students at a distance reported few, if any, first-time, full-time students. In fact, of the 14 institutions that reported OM data, half (50.0%) reported under 5% of the 2008 cohort were first-time, full time students. For those institutions, their Graduation Rate is calculated on less than 5% of their overall student population, which is why the Outcome Measures will be a better barometer of student progress for them.
First-time, part-time cohort
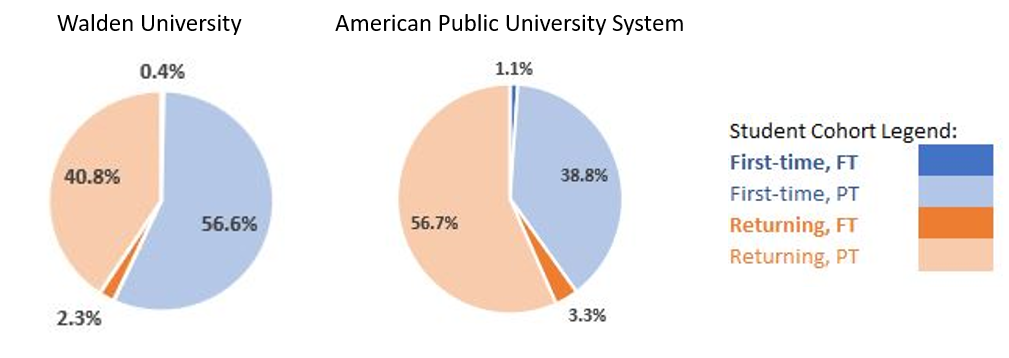
Institutions that are known to serve part-time students reported the largest numbers of students in the first-time, part-time cohort. Walden University led with 56.6% of the cohort, followed by American Public University System with 38.8% of reported students being first-time, part-time in 2008.
As with first-time, full-time, several institutions reported few or no first-time, part-time enrollments.
Non-first-time (transfer-in), full-time cohort
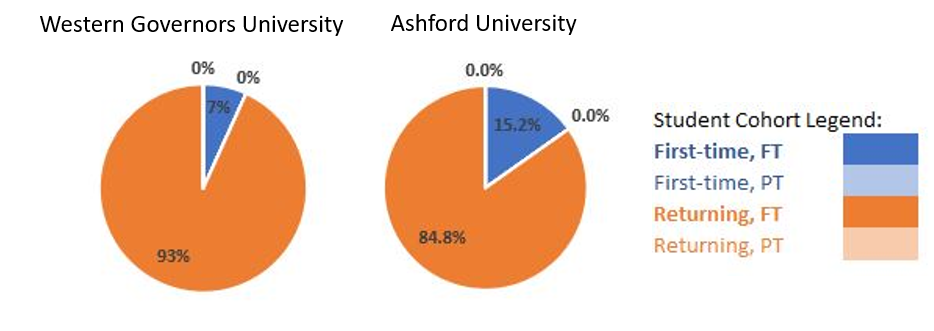
Institutions that focus on serving full-time students, with a promise of accelerated degree completion through credit for life experience or competency-based education, led with reported enrollment in the returning, full-time category for the 2008 cohort. Western Governors University (WGU) reported 93% of their students in this category; Ashford University reported 84.8%.
Non-first-time (transfer-in), part-time cohort
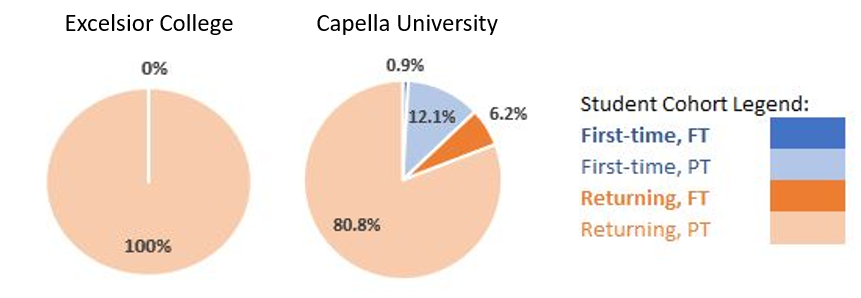
Excelsior College reported all (100%) of their enrollments as returning, part-time, followed by Capella University reporting 80.8% of their 2008 enrollment in that category. Both institutions have a mission focused on serving adult learners, many of whom cannot attend college full-time. As previously noted, institutions that are designed to serve full-time students reported very small enrollments in this category.
Student Outcomes: What Happened to the Students?
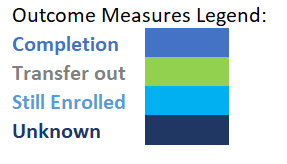
In addition to providing observations about the 2008 student cohort make up, the Outcome Measures data also provides insights regarding the disposition of the students over time. Institutions report student outcomes in one of four categories:
- Completion (Received an Award).
- Transfer Out.
- Still Enrolled.
- Unknown.
The data reported here are at eight years since matriculation (as of Fall, 2016). In addition to eight-year data, IPEDS also collects and reports outcomes at six years. We compared the six and eight-year data and found little difference. For simplicity and consistency, we decided to use only the eight-year outcomes in this analysis.
As noted by our WICHE Policy colleagues in their recent OM report that examined outcomes for students in the WICHE states:
“The credential rates from Outcome Measures data and graduation rates from Graduation Rate data are not synonymous and generally should not be interchanged. There are important distinctions as discussed in this brief. Users should clearly distinguish between OM and GR results.”
That report is a worthy read. With this caveat as background, let’s look at the outcomes.
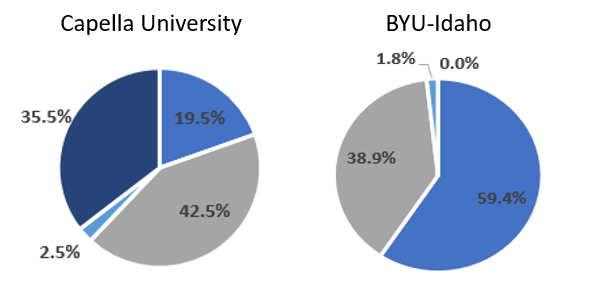
Completion
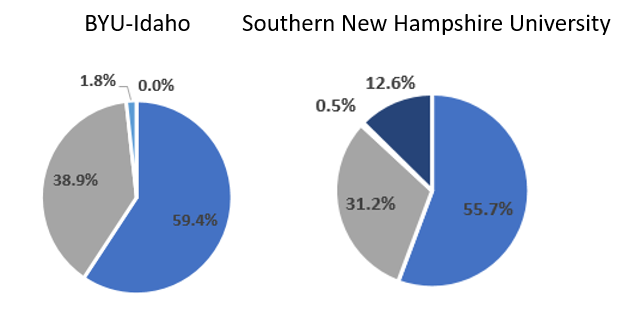
Completion indicates that the student received a certificate or degree within eight years of entering the institution. Of the top 15 institutions in 2016, based on exclusively distance education enrollment, BYU-Idaho led in completions with 59.4%; Southern New Hampshire University reported 55.7% completion. It is important to remember that the enrollment reported was total enrollment, not just distance education students. On this measure the more traditional institutions did better than their less traditional counterparts.
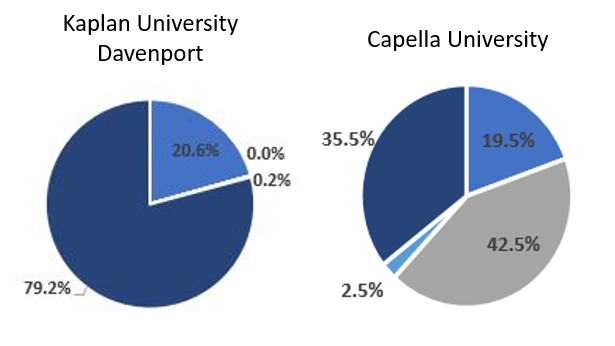
Institutions that reported the lowest completion rates include Kaplan University-Davenport Campus with 20.6% and Capella University with 19.5% completion at eight years. Both institutions also had unusually high percentages of students in the “unknown” category.
 Transfer Out
We know that a primary mission for many institutions of higher education is the successful transfer of students to other institutions. Of the reporting institutions in this analysis, Capella University led with 42.5% of students reported as transferred out, and BYU-Idaho reported the second highest transfer rate, at 38.9%.
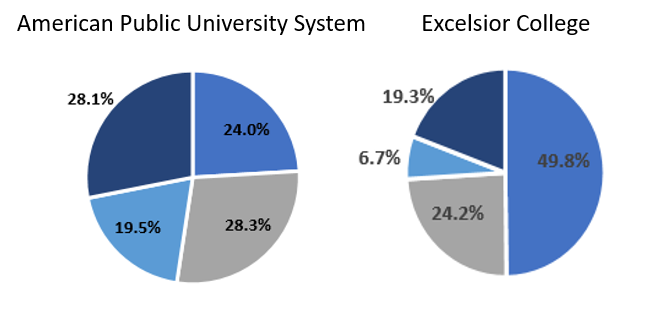
Still Enrolled
Eight years beyond the date of matriculation is 200% of the timeframe expected to complete a Bachelor’s degree, therefore, we expected this category of enrollment to be the smallest reported. However, institutions that are focused on serving part-time students would logically have the highest rates of students reported as still enrolled at eight years. These students are working toward their degree, often a few courses at a time. Of the reported institutions, American Public University System (which has a large number of students in the military) led with 19.5%. Excelsior College ranks a distant second with 6.7% of reported enrollment reported as still enrolled.
Unknown Outcomes – Those with High Percentages
Student enrollments that did not result in one of the prior dispositions are reported as “unknown”. These are troubling outcomes, as it is the responsibility of institutions of higher education to track student progress.
There are three institutions in this sample with over 70% of their student outcomes reported as unknown: Kaplan University-Davenport (79.2%), University of Maryland-University College (72.2%), and University of Phoenix-Arizona campus (71.0%).
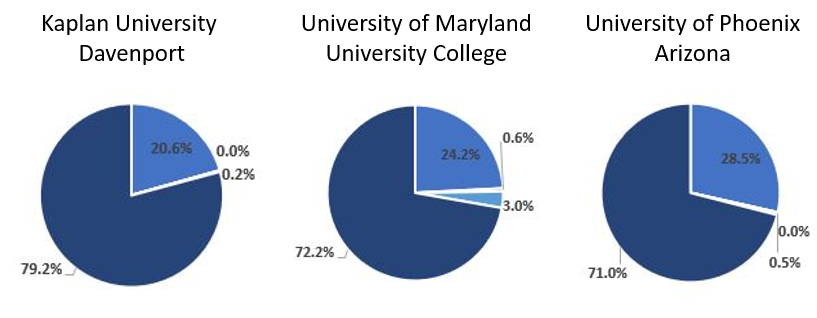
It is unclear whether the “unknown” classification is due to the students having dropped out, is due to an inadequate classification of students as this is the first OM data collection, or some other reason. It will be interesting to watch the results in the upcoming years.
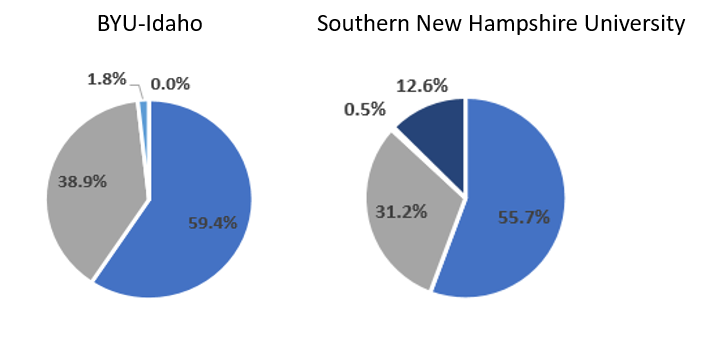
Unknown Outcomes – Those with Low Percentages
Among the 14 institutions we examined, those that reported few students with “unknown” outcomes include BYU-Idaho reporting 0% (that is remarkably low) and Southern New Hampshire University reporting 12.6% of students with “unknown” outcomes.
Outcome Measures Creates a New View of Positive Student Outcomes
As we previously stated, the above institutions also
have a sizeable on-campus contingent. What about institutions that are focus completely on non-traditional students? For technical reasons the exact percentage for the Graduation Rate might be slightly different than the completion percentage for the Outcome Measures statistic. For purposes of these analyses, we will imagine that they are close to each other.
When we had only the Graduation Rate, the implication was that those who did not graduate were drop-outs or that the institution how somehow failed to student. By adding the additional outcomes categories, we can see that institutions might not graduate a student, but that the student is still well served. The two institutions listed below show a large percentage of students who transferred out or are still enrolled. While eight years is a long time to be still enrolled, for adults with work and families, they may be able to take only a few classes at a time.
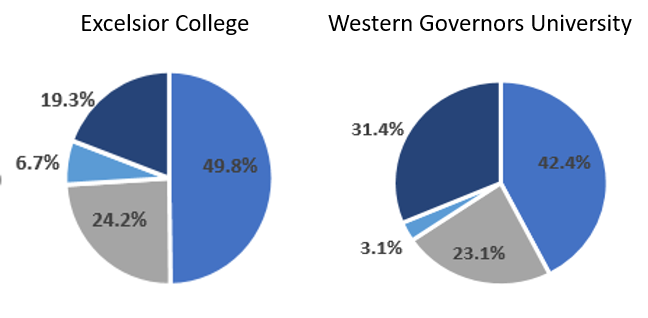
For Excelsior College, examining completions alone would show success for fewer than half of their enrollees. With the OM, fewer than one-in-five are in the “unknown” category.
A Caveat about First-Year Data Collections
We know from our early work with IPEDS distance education data that the first year of reporting may yield problems in reporting resulting in high numbers of enrollment categorized as “unknown.” We have also noted that the proportion of students reported as “unknown” tends to decrease as institutions become familiar with the new reporting and are able to adjust their systems to better capture the data required.
However, having such large proportions of students reported with an “unknown” disposition is never-the-less concerning. The cost of higher education is high, both to students and to our society. When institutions accept students and their tuition and fees, they should be able to report what happened to the student.
The Next Post – Community Colleges and Colleges/Universities in Colorado
In our next blog post, we will look more closely at public institutions in Colorado, as a sampling of Outcome Measures in a single state. We will also urge you to conduct your own analyses.
These data are a gift…and the result of hard work by all the reporting institutions. Let’s use them.
~Russ and Terri

Russell Poulin
Director, Policy & Analysis
WCET – The WICHE Cooperative for Educational Technologies
rpoulin@wiche.edu | @russpoulin

Terri Taylor-Straut
Director of Actualization
ActionLeadershipGroup.com
1 reply on “Count All Students! Outcome Measures for Non-Traditional Institutions”
[…] « Count All Students! Outcome Measures for Non-Traditional Institutions […]