Summary
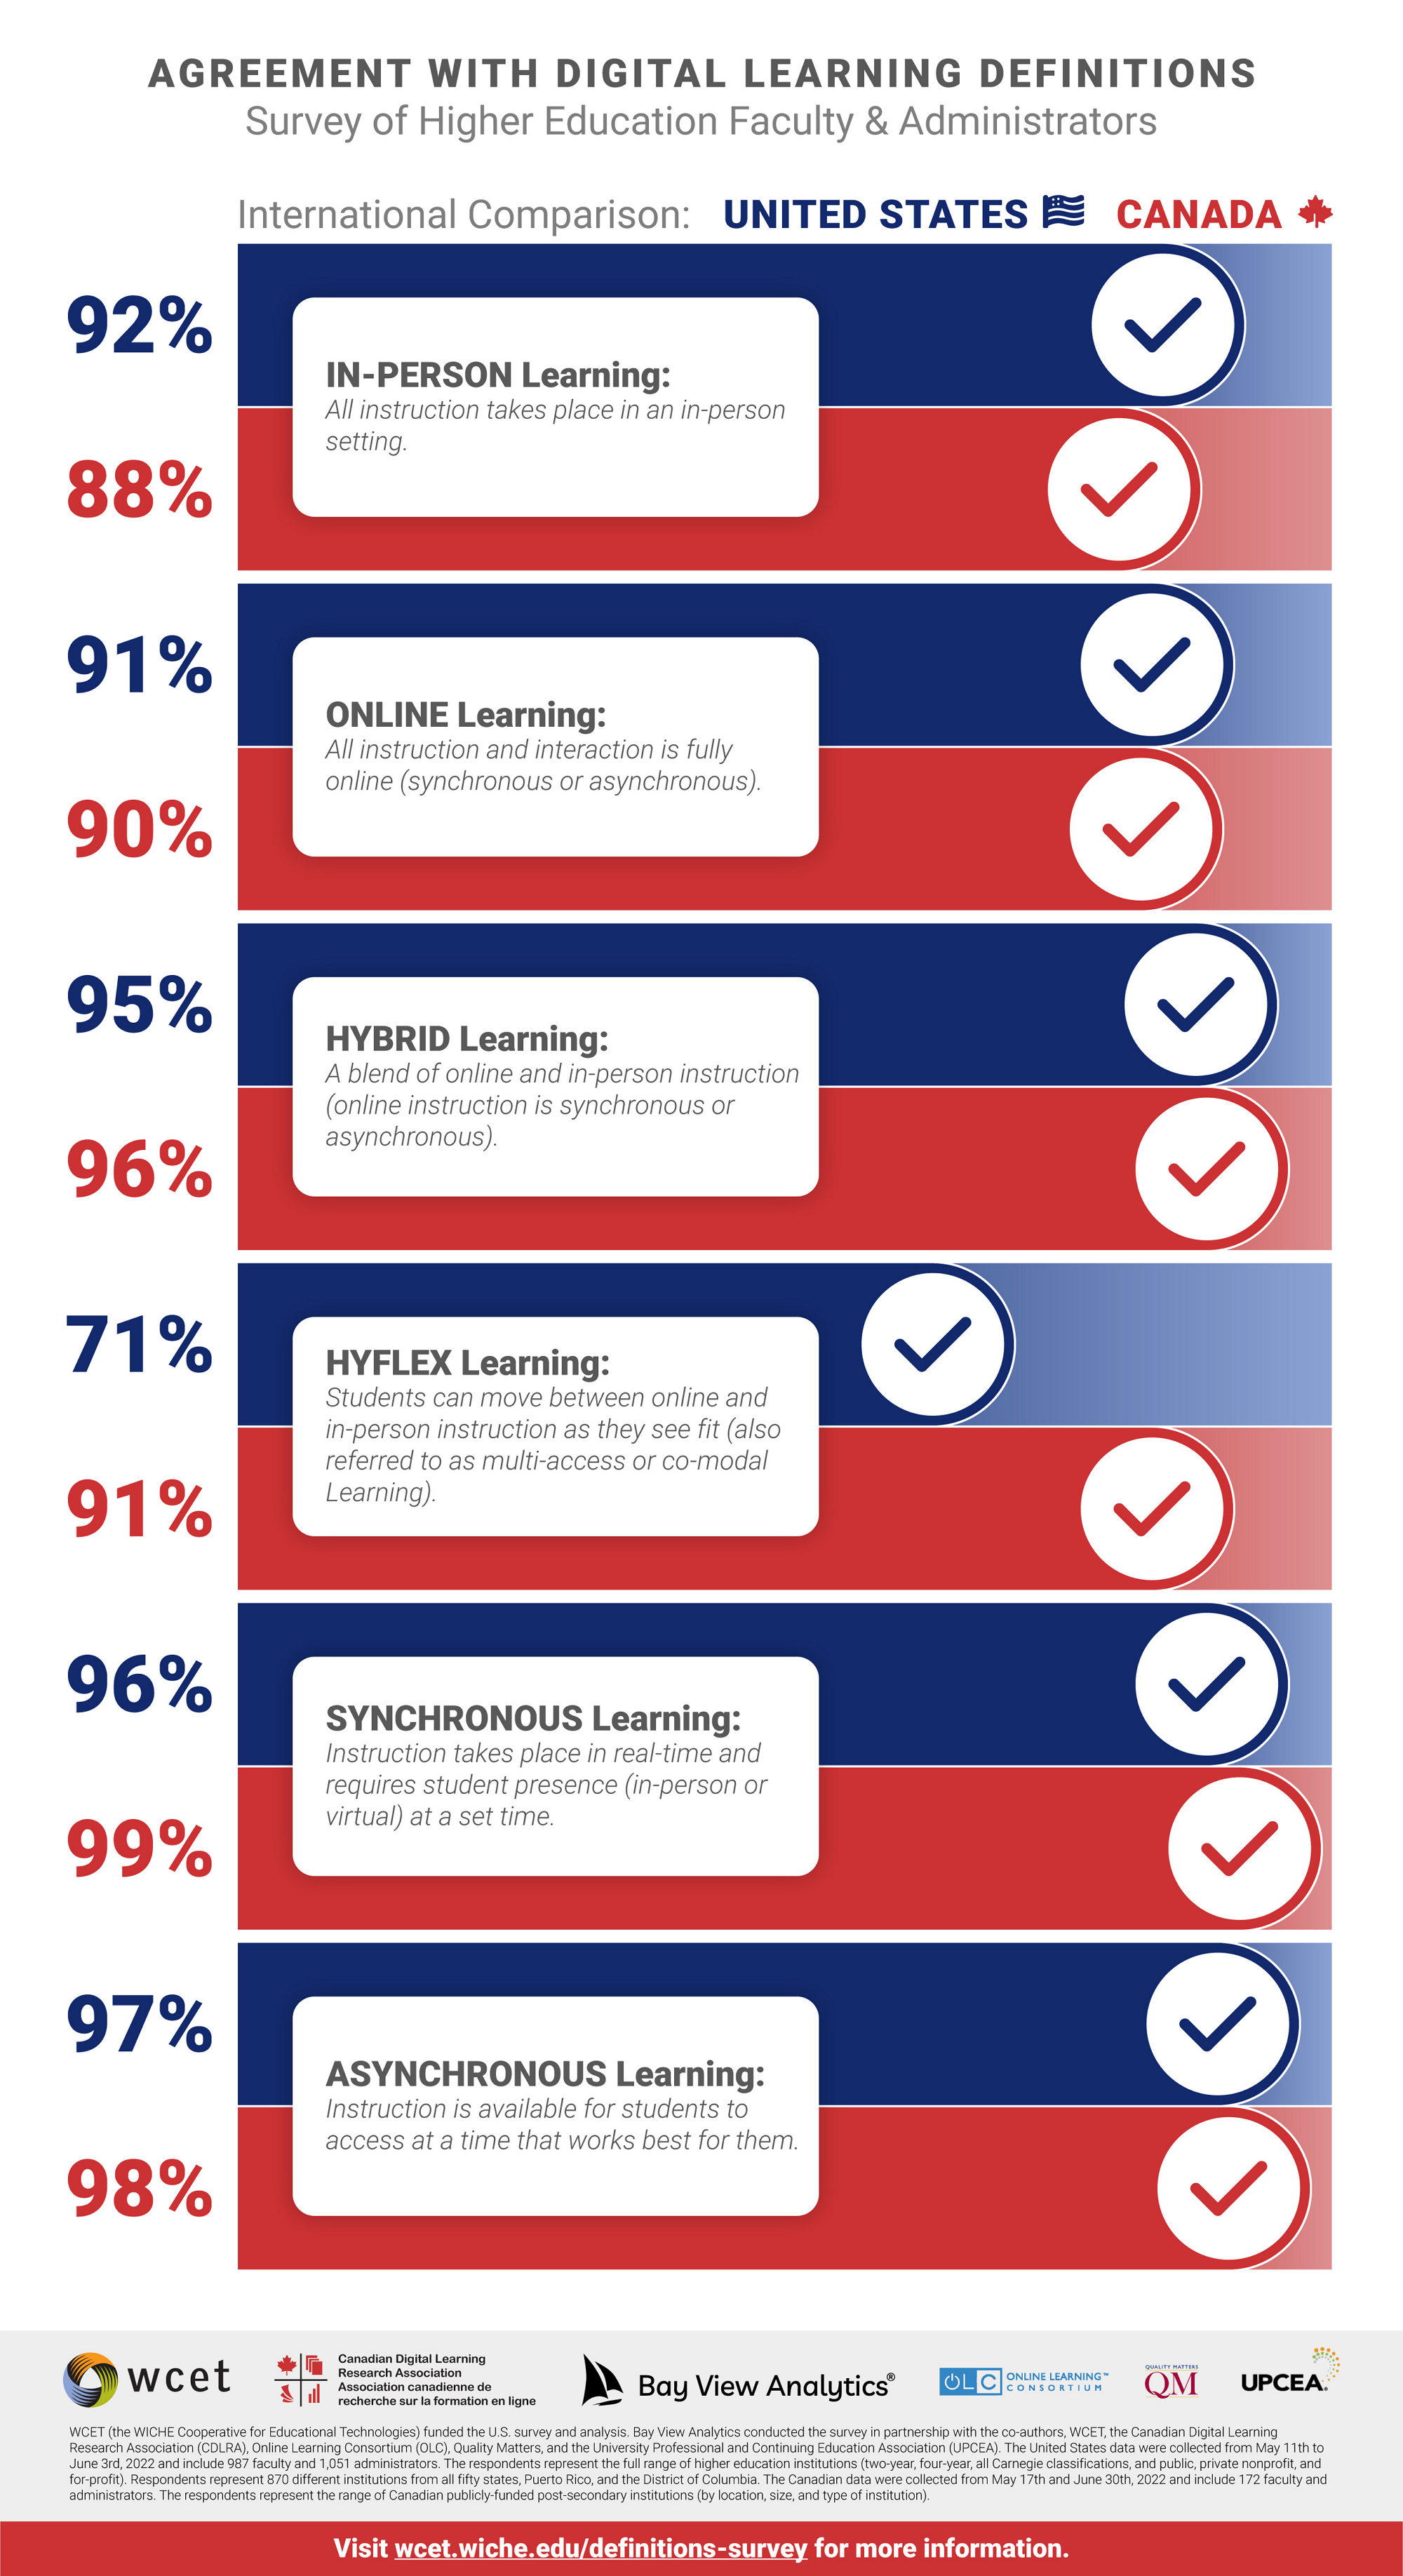
This infographic is a bar chart showcasing each digital learning term, the brief definition, and the percentage of survey respondents agreeing with that definition as broken down by surveys of U.S. respondents vs. Canadian respondents.
- In-person learning: All instruction takes place in an in-person setting. 92% agree for U.S. and 88% for Canada.
- Online learning: All instruction and interaction is fully online (synchronous or asynchronous). 91% agree for U.S. and 90% for Canada.
- Hybrid learning: A blend of online and in-person instruction (online instruction is synchronous or asynchronous). 95% agree for U.S. and 96% for Canada.
- Hyflex learning: Students can move between online and in-person instruction as they see fit (also referred to as multi-access or co-modal learning). 71% agree for U.S. and 91% for Canada.
- Synchronous learning: Instruction takes place in real-time and requires student presence (in-person or virtual) at a set time. 96% agree for U.S. and 99% for Canada.
- Asynchronous learning: Instruction is available for students to access at a time that works best for them. 97% agree for U.S. and 98% for Canada.
Footnote reads: “WCET (the WICHE Cooperative for Educational Technologies) funded the U.S. survey and analysis. Bay View Analytics conducted the survey in partnership with the co-authors, WCET, the Canadian Digital Learning Research Association (CDLRA), Online Learning Consortium (OLC), Quality Matters, and the University Professional and Continuing Education Association (UPCEA). The United States data were collected from May 11th to June 3rd, 2022 and include 987 faculty and 1,051 administrators. The respondents represent the full range of higher education institutions (two-year, four-year, all Carnegie classifications, and public, private nonprofit, and for-profit). Respondents represent 870 different institutions from all fifty states, Puerto Rico, and the District of Columbia. The Canadian data were collected from May 17th and June 30th, 2022 and include 172 faculty and administrators. The respondents represent the range of Canadian publicly-funded post-secondary institutions (by location, size, and type of institution).”
Note at bottom of the page reads: “Visit wcet.wiche.edu/definitions-survey for more information.”
Details
- Year Published : 2022
- Month Published : September
- Media Type : pdf
