IPEDS Fall 2013: Distance Education Data Reveals More Than Overall Flat Growth
Published by: WCET | 3/10/2015
Tags: Data And Analytics, IPEDS, Research, WCET
Published by: WCET | 3/10/2015
Tags: Data And Analytics, IPEDS, Research, WCET
The first blog post in this series analyzed the Fall 2013 distance education enrollment data (as released by the U.S. Department of Education’s IPEDS survey) sector-by-sector. The post revealed that one-of-four students took at least one distance education course and that public institutions continue to remain the largest provider of DE courses.
While the 2012 IPEDS survey provides a shaky base for comparison, let’s see what we can learn. Again, thank you to Terri Taylor Straut for the deep dive into these data.
Russ Poulin
For the first time, we have two sets of IPEDS Distance Education (DE) data. The industry is anxious to have benchmark data that will help us determine trends in the marketplace.
While we still have grave reservations over the accuracy of the IPEDS data reported (some colleges used different definitions, some did not report all enrollments), the data set is the most comprehensive and bears examination. The biggest caveat is this: Given the errors that we found in colleges reporting to IPEDS, the Fall 2012 distance education reported enrollments create an unstable base for comparisons.
 A new concern for the comparison of data by educational sector between Fall 2012 and Fall 2013 is the fact that many institutions have changed their IPEDS identification numbers and how they report. For example, in Fall 2012, all DE enrollments for the Arizona State University were reported through a single IPEDS number, in Fall 2013, five separate campuses reported DE enrollments. Anyone who wants to dig into the data for themselves needs to be aware of these changes in the data set.
With these caveats, let’s take a look at the data regarding overall higher education enrollments as that will provide context on trends in distance education enrollments.
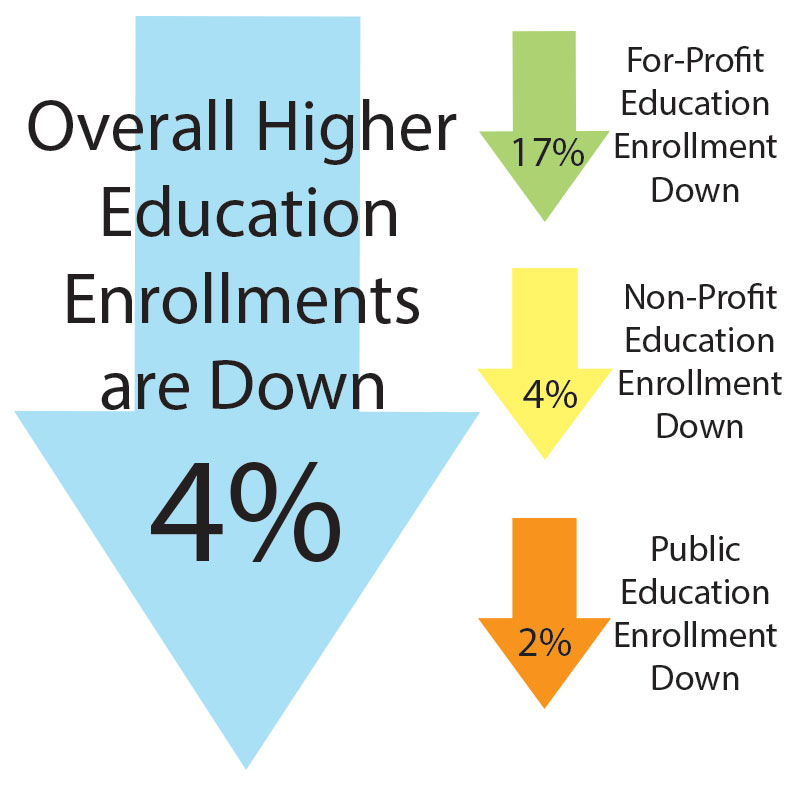
It is important to understand the enrollment trends by sector. The table below shows that while all sectors report declining enrollment, between 2012 and 2013, the retrenchment in the For-Profit sector, with a decline of 17%, is significantly greater than the other two sectors.
Table 1: Total Enrollment by Sector 2012 to 2013
| 2013 | 2012 | % Change | |
| Public | 14,745,558 | 15,085,798 | -2% |
| Private, Non-Profit | 3,974,004 | 4,118,688 | -4% |
| Private, For-Profit | 1,656,227 | 1,932,857 | -17% |
| Total | 20,375,789 | 21,137,343 | -4% |
Comparisons of overall IPEDS enrollment data for Fall 2012 and Fall 2013 reveal no growth, or a slight decline (-1.3%) in total student enrollments. Analysis of the IPEDS categories, “exclusively enrolled in DE courses” and “enrolled in some but not all DE courses” reveal increases in enrollment of less than 1%. Given the known problems with IPEDS data validity and the fact that these changes are so small, we conclude that there is no growth in higher education DE enrollments for the first time since this data has been reported. Phil Hill’s blog on this topic provides additional detailed analysis.
Table 2: Annual DE Enrollment Comparisons
| All Students Enrolled | Exclusively DE Courses | Some but not all DE Courses | At Least One DE Course | At Least One DE Course as % Total Enrollment | |
| 2012 | 20,642,819 | 2,653,426 | 2,842,609 | 5,496,035 | 26.6% |
| 2013 | 20,375,789 | 2,659,203 | 2,862,991 | 5,522,194 | 27.1% |
| % Change | -1.3% | .2% | .7% | .5% | 1.8% |
Fully Distance Ed Growth Varied Greatly by Sector:
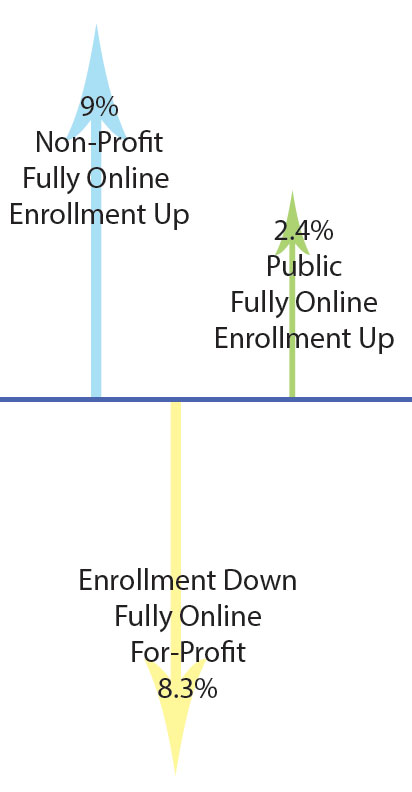
Combining all the enrollments from each sector provides an incomplete picture of the distance education trends. For many reasons, the for-profit sector is in a major retrenchment mode. Their fall enrollment decline (71,154 fewer fully distance students than last year) is dragging down the other two sectors.
Most notable is the growth in fully online enrollments in non-profit institutions. Their fully distance enrollments grew by almost 47,000, which is almost 9% more than last year. This is especially notable in the context of overall enrollment in public colleges, which fell by 4% from year to year. Non-profit institutions have fewer students and many of those that they are retaining are going online.
The change in fully distance enrollments in Public colleges is relatively flat at 2.4%, but occurred at the same time that Public colleges lost 2% of their enrollment.
Table 3: Percentage Change (2012 to 2013) in Distance Education Enrollment for Students Enrolled Exclusive at a Distance by Sector
| Sector | Exclusively DE Courses 2013 | Exclusively DE Courses2012 | % Change |
| Public | 1,281,880 | 1,251,398 | 2.4% |
| Private, Non-Profit | 520,390 | 473,941 | 8.9% |
| Private, For-Profit | 856,933 | 928,087 | -8.3% |
| Total | 2,659,203 | 2,653,426 | 0.2% |
Enrollment in Some But Not All DE Courses is Also Mixed by Sector:
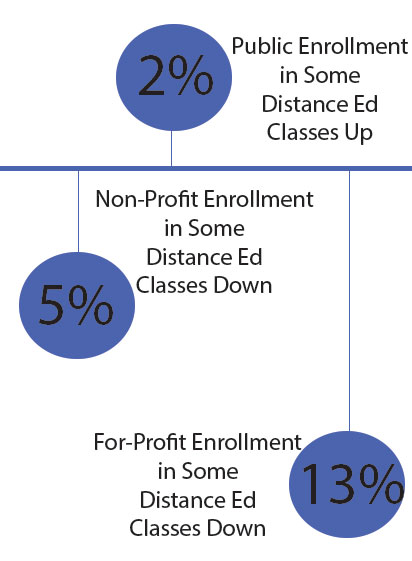
While the combined reporting shows a very small gain in enrollment of .7%, the differences among the sectors in these categories is significant. Publics maintained growth of about 2% between 2012 and 2013. Non-Profits report a loss of about 6% in this category of DE enrollments. The For-Profits report the greatest loss at nearly 13%. Once again, sector analysis reveals significantly different results.
Table 4: Percentage Change (2012 to 2013) in Distance Education Enrollment for Students Taking Some (But Not All) Distance Courses by Sector
| Some But Not All DE Courses 2013 | Some But Not All DE Courses 2012 | % Change | |
| Public | 2,462,362 | 2,409,595 | 2.1% |
| Private, Non-Profit | 275,020 | 291,144 | -5.9% |
| Private, For-Profit | 125,609 | 141,870 | -12.9% |
| Total | 2,862,991 | 2,842,609 | 0.7% |
The final category of DE enrollments, “at least one DE course”, is calculated by adding the IPEDS categories “exclusively DE courses” and “some but not all DE courses”. The combined data reveal that only For-Profits actually lost DE enrollments, overall, between 2012 and 2013. Both Publics and Non-Profit overall DE enrollment actually grew during the period. This is another case where the sector analysis shows a very different picture than looking at combined data alone. While overall there is no significant growth in DE enrollments, it is clear that the growth in Publics and Non-Profits is actually negated by the decline in For-Profit enrollment.
Table 5: Percentage Change (2012 to 2013) in Students Taking At Least One Distance Education Course by Sector
| At Least One DE Course 2013 | At Least One DE Course 2012 | % Change | |
| Public | 3,744,242 | 3,660,993 | 2.2% |
| Private, Non-Profit | 795,410 | 765,085 | 3.8% |
| Private, For-Profit | 982,542 | 1,069,957 | -8.9% |
| Total | 5,522,194 | 5,496,035 | 0.5% |
Large Players Enrollment Changes Impact Total Enrollment
Closer evaluation of the largest institutions in the distance education market, measured by student enrollment, reveals interesting results. There is large variations year-to-year of reported student enrollment in “exclusively DE courses” by some of the largest players in the market place. With large sums of money being spent on advertising by public and private schools alike, the winners and loser are a bit surprising.
Table 6: Institutions with Large Variation in DE Enrollments between 2012 and 2013
| Institution | Total 2013 Enrollment | 2013 Exclusively DE Enrollment | 2012 Exclusively DE Enrollment | % Change |
| For- profit Institutions | ||||
| Grand Canyon University | 55,497 | 45,496 | 28,417 | 38% |
| Kaplan University-Davenport Campus | 52,407 | 52,131 | 44,678 | 14% |
| University of Phoenix-Online Campus | 212,044 | 207,060 | 250,600 | -21% |
| Ashford University | 58,104 | 57,235 | 76,722 | -34% |
| Non-profit Institutions | ||||
| Southern New Hampshire University | 28,389 | 20,701 | 10,679 | 94% |
| Western Governors University | 46,733 | 46,733 | 41,369 | 19% |
| Liberty University | 77,338 | 64,503 | 61,786 | 4% |
| Public Institution | ||||
| Arizona State University—All Campuses | 76,728 | 9,958 | 7,444 | 34% |
University of Phoenix-Online Campus maintains the number one ranking, by far, with 2013 total enrollment of 212,044 students; 207,060 are reported as fully online. However, they lost 21% of their enrollment in just one year. The other big loser in reported enrollments is Ashford University with a 34% enrollment decline, from 76,722 online enrollments in 2012 down to 57,235 enrollments in 2013.
Big enrollment winners during the period 2012 to 2013 include Private, Non-Profits. Western Governors University reported 19% online enrollment growth, with 2013 enrollments at 46,733 and Liberty University reported a 4% gain, growing to 64,503 fully DE enrollments in 2013.
Among the largest schools, Grand Canyon University, a Private, For-Profit shows the highest growth for the period at a 38% enrollment increase from 28,417 online enrollments to 45,496 in a single year, Kaplan University, also Private, For-Profit reported a 14% enrollment increase, and 52,131 exclusively DE students.
The public reporting and the Fall 2013 IPEDS data support the fact that some of the large For-Profit players are retrenching and have experienced significant enrollment decline. We were curious to see if the increased advertising that we are seeing from some of the smaller institutions is resulting in enrollment gains.
 Arizona State University, a Public IHE, has been actively seeking students from outside Arizona through radio advertising, billboards, etc. According to their IPEDS reporting, ASU increased their online enrollments by 34% between 2012 and 2013, resulting in nearly 10,000 exclusively DE enrollments in 2013. A private, non-profit institution, Southern New Hampshire University, reported a whopping 94% enrollment growth in fully online enrollments in the same period, nearly doubling those enrollments from 10,679 to 20,701. While far from a scientific sampling, it does appear that targeted, effective advertising can have a significant impact on enrollment growth. What is not publicly known is the cost to gain those increases in enrollment.
The next blog in the series will focus on the data reported with regard to where the students who are in exclusively DE courses are physically located in relation to the geographic location of the IHE serving them. This is important information for institutional leaders responsible for compliance; regulators and policy-makers who are working to create a more manageable state authorization process.
Note: We erroneously listed Southern New Hampshire University as a public institutions in the second-to-last paragraph. That has been corrected. (03/16/15)
 Terri Taylor Straut
Ascension Consulting
 Russ Poulin
Director, Policy and Analysis
WCET
3 replies on “IPEDS Fall 2013: Distance Education Data Reveals More Than Overall Flat Growth”
[…] « IPEDS Fall 2013: Distance Education Data Reveals More Than Overall Flat Growth […]
WCET has created an infographic to go along with this data – Busting the Myth: Distance Education Enrollment http://wcet.wiche.edu/learn/busting-the-myth-distance-education Please share!
[…] qualification assumptions of broad-based outgrowth necessarily to be reconsidered.Pingback: IPEDS Fall 2013: Distance Education Data Reveals More Than Overall Flat Growth « WCET Frontier…Entertain the implications hither if on-line teaching has stopped-up growth in US higher […]