New Digital Learning Compass Shows Distance Ed Enrollments Trending Upwards
Published by: WCET | 5/2/2017
Tags: Distance Education, Enrollment, IPEDS, Online Learning, U.S. Department Of Education, WCET
Published by: WCET | 5/2/2017
Tags: Distance Education, Enrollment, IPEDS, Online Learning, U.S. Department Of Education, WCET
Higher education enrollments for all students fell, but more students enrolled in distance education courses than ever before. This is one of the findings of the new “Distance Education Enrollment Report 2017” released by the new Digital Learning Compass partnership.
The report uses data for the 2015 U.S. Department of Education IPEDS Fall Enrollment survey. Since the Fall term of 2012, IPEDS has collected distance education enrollment data. In the report, released today, analysis of both the most current year’s data (2015) and the trends over the past few years are examined. The distance education community is thankful that the Department continues collecting this data.
WCET is pleased to partner with the Babson Survey Research Group and e-Literate to update you on distance education enrollments. Together, the three organizations form the Digital Learning Compass, which seeks to be the definitive source of information on the patterns and trends of U.S. postsecondary distance learning. This work is made possible by the sponsorship of Online Learning Consortium, Pearson, and Tyton Partners. Thank you sponsors!
Prior to the IPEDS data collection, Babson conducted its own surveys. Since the IPEDS release, the three organizations worked together and separately in their analyses. We decided that we could accomplish more by partnering. We also like geeking-out on the numbers together.
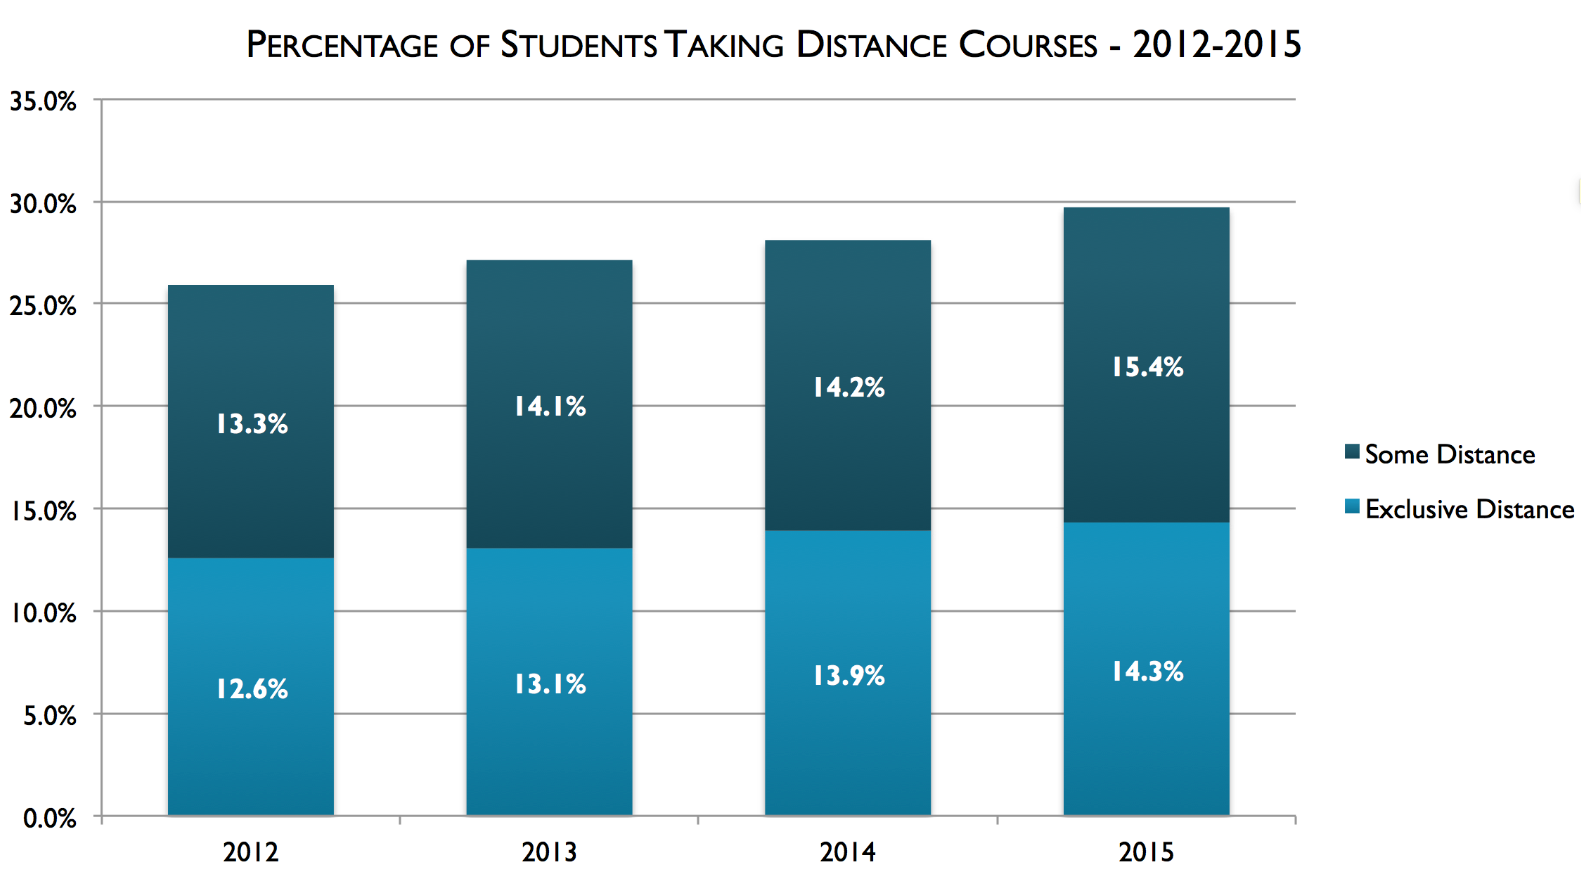
Again this year, the percentage of students studying exclusively at a distance and those enrolled in some distance courses increased over the previous year. Altogether, more than six million students were enrolled in distance courses in the Fall of 2015.

The percentage increase is due both to growing enrollments in distance education and decreased enrollments in non-distance course participation. On-campus enrollment has fallen by 5% since 2012. Note that these statistics do not include blended or hybrid courses that replace some of the face-to-face time with online activities.
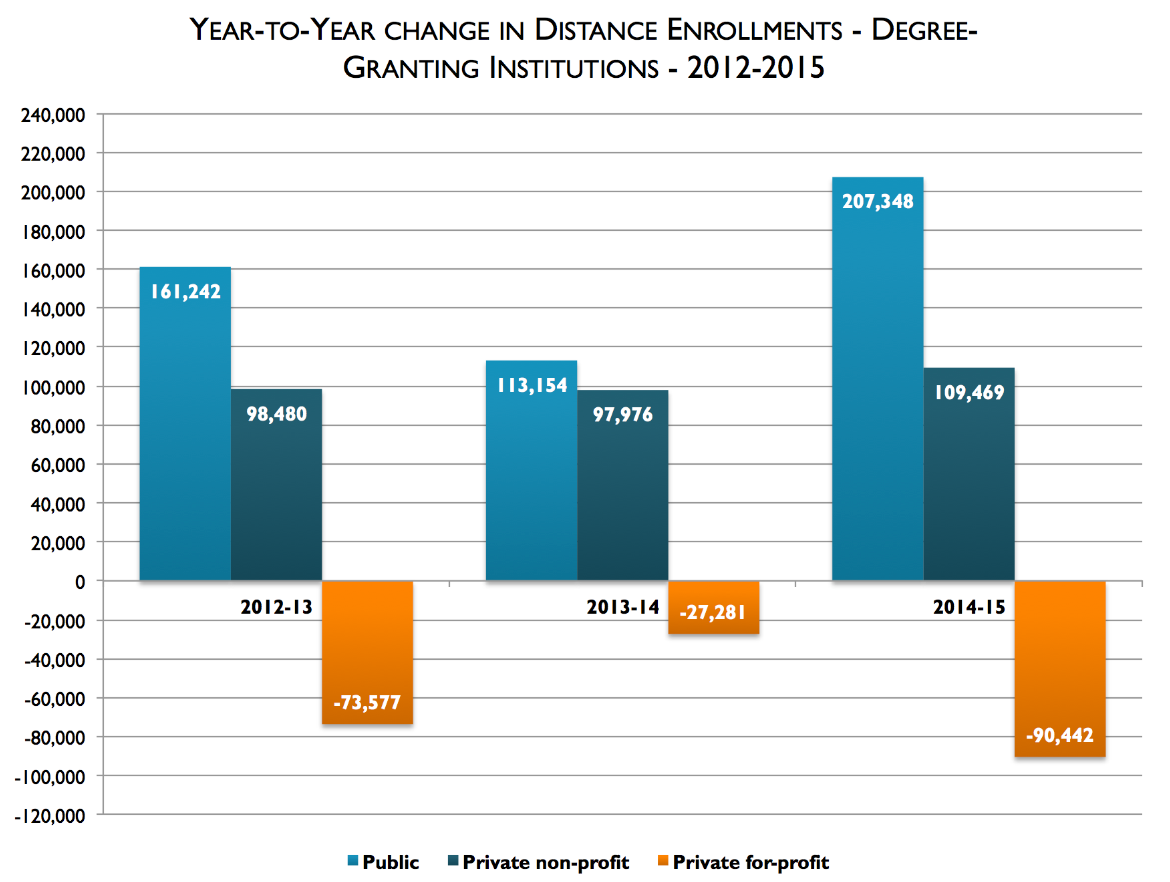
The public and the private not-for-profit sectors continue to enjoy healthy growth in distance education enrollments. Meanwhile, the for-profit sector continued its trend of losses. For the for-profit sector, it is important to note that a majority of institutions in that sector actually increased enrollments. A small number of the larger for-profit institutions account for the downturn in the overall numbers for that sector.

While public institutions enjoyed the largest growth, the increases represent a 13.4% change from 2012 to 2015. Over the same time period, the private not-for-profit sector has grown distance education enrollments by 40.0% and private, for-profit institutions have lost 18.0% of their enrollments. Hmmm….guess those numbers will really change in the future if Purdue acquires Kaplan!
It is interesting to note how different sources treat these numbers. One very recent article cited that “fierce competition has tamped down the once-frantic pace of growth,” while another trumpeted growth with a headline declaring that “colleges rush to ramp up online classes.” Are you feeling frantic or rushed…or just confused? Growth is sustained only when done thoughtfully.
If you would like to learn more, I suggest going to the Digital Learning Compass site and download the full report. Many thanks to WCET’s Rosa Calabrese and WICHE’s Jon Fellers for the work on creating this website!
You can watch an archive of a WCET webcast in which the results were discussed.
Later this year, we will be releasing additional “in-depth” reports that examine particular aspects of the data. If you would like to sponsor such a report, let me know.
Next week watch for interviews regarding the differences in distance education definitions.
My Digital Learning Compass friends and I encourage your feedback and questions.
Russ
 Russell Poulin
Director, Policy & Analysis
WCET – The WICHE Cooperative for Educational Technologies
rpoulin@wiche.edu @russpoulin

7 replies on “New Digital Learning Compass Shows Distance Ed Enrollments Trending Upwards”
Reblogged this on Sasha Thackaberry and commented:
Very timely report from @WCET and @PhilOnEdTech etc!
[…] the years. Indeed, according the most recent annual Babson study on online enrollment trends, Digital Learning Compass (2017), the vast majority of online students actually attend public universities. The truth is, […]
[…] Russ Poulin at WCET […]
[…] « New Digital Learning Compass Shows Distance Ed Enrollments Trending Upwards […]
[…] be repeated, but the incentives are in place for similar moves. A recent Digital Learning Compass study found that nearly 30 percent of higher education students are enrolled in distance learning in […]
[…] be repeated, but the incentives are in place for similar moves. A recent Digital Learning Compass study found that nearly 30 percent of higher education students are enrolled in distance learning in […]
[…] though more than one-quarter of all higher education students in the United States and a roughly equivalent number in Canada now take at least one distance education course, it is […]