A 2014 WCET Outstanding Work (WOW) Award winner, the Northern Virginia Community College (NOVA) OER-Based Associate Degree Project has saved its students nearly half a million dollars in its pilot year. Read on as Wm. Preston Davis, Director of Instructional Services, shares with us the values, processes and outcomes of this innovative program.
When I joined NOVA four years ago, I was almost overwhelmed by the size and scope of the institution. NOVA is one of the largest Community Colleges in the nation, serving a broad and diverse student population of over 70,000 students. NOVA also has one of the largest and most robust distance learning programs in the country, with 25,000 students enrolled in online courses. I immediately saw the importance of the college to the extended community, and envisioned a program that could help to alleviate some of the challenges facing students at NOVA by utilizing open educational resources.
OER Associate Degree Project
NOVA’s OER-Based Associate Degree Project is a comprehensive approach to addressing concerns over access, affordability and student success. There are three major goals of NOVA’s OER-Based Associate Degree Project:
To increase access to higher education. By making sure that each course includes all of the course materials and resources that students need, we are putting all students on the same level. Each student has equal access to the same information, ensuring fairness and equality among all students enrolled in the OER course.
To make higher education more affordable. By eliminating the burden of additional textbook costs for students, the actual cost of taking an OER course is reduced. Often, this is a significant reduction in cost which translates to considerable savings over time. This can result in much lower student debt, making attaining the Associate Degree easier and more valuable.
To increase student success at NOVA. By giving all students in an OER course equal access, and removing the burden of additional expenses to those who can least afford them, students have a better chance of being successful in the course, continuing their enrollment, and achieving their academic goals.
NOVA’s OER-Based Associate Degree Project is a two-phase project. In phase 1, we focused on a series of first-year, high-enrollment general education courses leading to a general studies certificate. In phase 2, we continued with a series of second-year, high-enrollment courses which allowed us to develop two full Associate Degree track options that use free and open educational resources.
Educational Technology
We developed our OER-Based Associate Degree Project to be delivered online, so that any student at any NOVA campus could have the opportunity to take these courses. Our online students are familiar with technology and find having OER embedded into their online courses conducive to their learning.
Building digital content and resources into an online course helps to better engage the learner and keep them focused on the course material. This leads to better knowledge retention, better course outcomes, improves their information literacy skills, and better prepares students to function more effectively in technology adapted careers.
Planning and Implementation
To accomplish this large and challenging project, it was crucial to build a team of dedicated and skilled faculty and staff who shared my vision. We had support from college leadership, and maximized our internal resources to accomplish our goals efficiently and effectively. Our Distance Learning Librarians provided guidance and expertise in locating and curating information and materials. Our Instructional Designers provided content organization and online instructional delivery expertise. Most importantly, we recruited select faculty with a history of innovative teaching as the content experts to design and teach the new OER courses.
Outcomes
The team-based adoption and implementation model developed for NOVA’s OER-Based Associate Degree Project can be applied by any institution. The model is scalable and is applicable to traditional, hybrid and online modalities. Furthermore, this model can be adapted to the level of education offered by the institution. Several other institutions have already begun development of an OER Certificate program based on our model.
We have seen immediate benefits of the OER-Based Associate Degree project, measuring cost-savings to students in hundreds of thousands of dollars. But the impact that these OER courses have on each individual student and their success in reaching their educational goals is the true measure of success. Over time, as our graduation rates grow and student debt shrinks, my colleagues and I will take great satisfaction in the difference that this OER project has made at NOVA and beyond.
Today we feature Ellen Wagner, Chief Strategy Officer, Predictive Analytics Reporting (PAR) Framework as she takes us on a tour of the post-secondary big data landscape, including reflections on the first three years of the PAR Framework.
It Begins With Big Data
One of the surest signs that a technology trigger is starting its roller-coaster ride through the (Gartner) Hype cycle of innovation is when the name we all call that trigger becomes a part of the public lexicon.
Today, Big Data is an all-encompassing term used to describe data sets so large and complex that it becomes difficult to process using traditional data processing applications. A quick search of Google Trends shows that references to Big Data started to appear in web references, literature, and popular press back in 2007, after Tom Davenport and Jeanne Harris published their book Competing on Analytics: The New Science of Winning (Harvard Business Review, 2007). Today, after only seven years, a Google search on Big Data will result in more than 857 million search results being surfaced. Big Data is so pervasive as an idea that it has become a meme, standing for something even bigger and more transformative than the data themselves. The term has come to stand for the idea that the records of activity that we leave in the path of our various digital engagements is just waiting to be mined by service providers, beacons, and embedded code strings, all in the service of optimized, personalized experience.
This Big Data Landscape 3.0 graphic by Matt Turck et al provides a high level visual representation of the breadth and complexity of the Big Data landscape. What is notable about this particular depiction is that very few of the companies in this graphic have very much to do with providing products and services for the post-secondary educational market in the United States. Some of the larger firms do have education lines of business, but these exist as part of a product company’s vertical market strategy rather than being explicitly aimed at big data services in education. The explanation for this apparent oversight is a simple one. Although Big Data has certainly ramped up expectations of accountability and transparency in higher education settings, most of the data driving decision-making in higher education comes to us in columns and rows. Data sets that present in columns and rows can certainly be massive in number; however, data reported in columns and rows is still too small to be considered a true Big Data asset.
Nevertheless, meme of Big Data has been an effective catalyst to help people start to imagine what it will take to move away from authority-driven decision-making in post-secondary education and to establish a culture of evidence-based decision-making. But at a more systemic level, the ability to leverage insights to anticipate opportunities for optimizing effectiveness will be one of the key attributes demonstrated by data-savvy organizations and enterprises. How we license our digital textbooks will have everything to do with data related to use and student performance; the design of adaptive and personalized experiences will all depend upon data to filter, aggregate, assemble and exchange content, assessments and engagements.
Learner Analytics
So it should be no surprise that interest in learner analytics – predictive, inferential and descriptive alike – has grown steadily in recent years. The Learning Analytics and Knowledge conferences provided a venue for exploring dimensions of learning analytics research. The Society for Learning Analytics Research (SoLAR) helps explore the role and impact of analytics on teaching, learning training and development. Purdue University’s Signals was among the first examples of using predictive analytics to identify students at risk, using a simple green – orange – red color scheme to flag students according to their risk probabilities. Sinclair College’s Student Success Plan provided early predictive case management support in the category for what is now emerging as Integrated Planning and Advising Systems (IPAS) tools and platforms. Rio Salado College used their PACE system to anticipate students at risk. Austin Peay University’s Degree Compass gave people an Amazon-like experience for course selection. Institutions including the American Public University System and the University of Phoenix made significant advancements in building sophisticated predictive analytics models to find students at risk. But it was the Bill & Melinda Gates Foundation’s investments in action analytics which helped jump-start and sustain multiple initiatives focused on building capacity to support using data to support and enable decision-making. In the post-secondary educational arena, these include Achieving the Dream , Completion by Design, as well as multiple waves of Next Generation Learning Challenges awards. PAR, the Predictive Analytics Reporting Framework , received its first of several round of funding from the Gates Foundation in May, 2011.
PAR – From a Big Audacious Idea to a Collaborative, Non-Profit Venture
For the past three years the PAR Framework core staff and institutional members have created one of the largest student outcomes data resources ever assembled, from the voluntary contributions of de-identified student record from each of our member institutions. We learned very early on that the common data definitions created to facilitate the exchange of records also provided us with the lexicon required for talking with one another about student risk, persistence, and success between and within institutions. We provide members with comparative benchmark reports. We provide localized predictive models generate a risk score for each (de-identified) student in the sample for each of our member institutions, and with access to dashboards for student watch-lists for designated professional staff including advisors and faculty.
The PAR Student Success Matrix (SSMX) then helps institutions comprehensively assess their student success policies, interventions and programs by organizing the wide variety of student supports – from orientation to mentoring to advising – into a systematic validated framework designed to quantify the impact of student success practices and determine the best support for students at the point of need. The SSMx also reveals gaps and overlaps in student support programs and gives institutions the tools to evaluate the efficacy of their investments at the program level. The common PAR measures for assessing and predicting risk and the validated frameworks categorizing student support services create the mechanism to effectively measure the impact of student supports within and across institutions.
Reflections
I was recently asked if I have been surprised by any of the things we have learned as PAR has evolved from a big audacious idea into being a learner analytics as a service provider for our members. I allowed that I have had three big surprises.
One of my biggest surprises has been the realization that even the most finely honed predictions of student risk are of marginal value if predictions of risk are not directly tied to actions to mitigate risks before those risks become realities. I have come to understand that prediction is the first step in a virtuous cycle of evidence-informed decision-making. By starting with a prediction of risk one can identify essential success behaviors that have been shown to mitigate the diagnosed risk. From this second step in the cycle, and with a diagnosis in hand, it is possible to link students with interventions designed to address diagnosed risks before they becomes a problem. Measures for assessing the relative impact and efficacy of that intervention can be linked to predictions of risk, bringing the cycle to its completion.
I have also been a little bit surprised that PAR’s common data definitions have turned out to be so strategically significant in our student success work. More to the point, I knew there were going to be essential for us to share data among multiple institutions. I just hadn’t realized that sharing our definitions would be useful for many others just getting started in analytics work. PAR’s common data definitions were recently identified as a key competitive advantage in this year’s Gartner Research Education Hype Cycle, 2014 Report . It is very satisfying to know that our efforts to create common data definitions have helped us communicate within and across data initiatives, with PAR’s openly published data definitions providing a stake in the ground for defining what we collectively mean when we talk about outcome measures and student success. More than 2,000 entities have downloaded our openly licensed definitions since we published it in 2013. PAR’s definitions have been cited in IMS Global’s Caliper specification, and in Unizen’s organizing documentation. PAR’s common data definition gives data projects a foundation for interchange, operating as a Rosetta Stone of student success data.
The third surprise, and perhaps the most satisfying one of all of my “big surprises” has been the degree to which educators, coming from all over the post-secondary ecosystem, will figure out ways to work together in the service of student success.We’ve seen that data of all shapes and sizes helps better inform the decisions we can make at ALL levels of the institution so that ALL education stakeholders – students, faculty and administration are better prepared to succeed. Whether online, blended or on-the ground, whether state funded or publicly traded, whether we are two year or four year institutions, whether we are traditional or progressive – we know we can move the needle when student success is everyone’s passion.
The PAR Framework community is actively looking for forward-thinking institutional partners to join us in our efforts to launch a culture of evidence based decision-making in the service of student success. Please join us in Portland to learn more about becoming a part of the PAR community.
At your cooperative, we’re always happy to share the learning of our members. Sharing with us today is Sally Johnstone, Vice President for Academic Advancement at Western Governors University, about the work WGU has done with community colleges to launch CBE programs and the resources they have produced, which are open to all.
As some of you may be aware, Western Governors University has been working with almost a dozen community colleges across the country for the last two years. Our role was to help them develop their own competency-based degree (CBE) programs. The staff members and faculty at these colleges worked at an incredible pace to incorporate the basic tenants of a CBE into their new programs. They were all faced with many challenges from both within and outside their institutions. They met these challenges creatively and within the context of their own campus cultures.
Among them the colleges now have over 3,000 students enrolled in CBE programs. The lessons they learned in their journeys from being vaguely aware of CBE to launching their own programs are being collected. This week we launched www.CBEinfo.org. It is site to help other community colleges learn from the pioneering work of Austin Community College, Bellevue College, Broward College, Columbia Basin College, Edmonds Community College, IVY Tech at both Fort Wayne and Lafayette, Lone Star College’s University Campus, Sinclair Community College, and Spokane Falls Community College.
One of the most remarkable aspects of all their work is that they integrated CBE into their regular campus operations. That effort has already enabled several of colleges to expand their CBE activities from a single degree or certificate program to include other academic areas. The preliminary evidence indicating improvement in student success encouraged faculty and staff not involved in the initial projects to pay attention.
Accommodating Campus Cultures
The varieties in the campus cultures I mention above include both strong and loose system arrangements plus almost total autonomy. Some campuses had faculty unions, some did not. Some campuses were in states that tend to micromanage academic activities, like requiring A – F grades in each course. These grades become meaningless when students are progressing by demonstrating mastery of the courses and working at different paces to achieve it. The solution in this case was to assign a grade but redefine ‘passing’. At a different campus, the faculty did not have state mandates to assign grades, but their student information system did require it. Their solution was to consider an ‘A’ or ‘B.’ If a student earned a ‘C’ or lower he/she was allowed to continue working toward the degree but in a more traditional distance learning program.
As you explore the lessons on the site, you will also notice that the organizational structure to support CBE was dependent on the culture at each college. For example, at Sinclair Community College they already had in place a sophisticated distance learning support center. The faculty on campus were used to working with instructional designers who used common course templates. This was a very good fit for the development of their CBE program. In addition, they had developed technological tracking systems that allowed them to flag at risk distance learning students. This was adapted to their CBE program and helped their academic coaches know which students might be struggling with their courses.
In contrast, at Austin Community College they did not have a centralized distance learning operation. Consequently they created a support structure for CBE students and the faculty developing the courses within the academic department in which the program was housed. It was a good way to get started, but as other academic departments are beginning to develop their own CBE programs, the staff in the Dean’s office is developing a new plan that will have some of the characteristics of the Sinclair center.
Interaction with the pioneers
Throughout this whole project all the colleges have been learning from one another. They will continue to do so as they modify their initial practices to better serve their students. We now invite you to join in that sharing process. Within www.CBEinfo.org is a Discussion option. The staff and faculty from the partnering colleges have agreed to pay attention to questions and comments in that section and share what they have learning and are learning.
I look forward to seeing you online.
Sally M. Johnstone
Vice President for Academic Advancement
Western Governors University
The University of Wisconsin-Milwaukee is a 2014 WCET Outstanding Work Award winner for their innovative online instructional approach, U-Pace. Today Diane Reddy and Ray Fleming, co-creators of U-Pace and Laura Pedrick, executive director of UWM Online, share with us a little about the program.
Putting data into action. Valuable student data is now easily available to instructors through the Learning Management System (LMS) at their college or university. A wealth of information about each student’s work habits and progress is automatically recorded for each course. But while advances in learning management systems and learning analytics are accelerating, a gap remains between instructors’ ability to access student data and to act upon the data in an empirically-based way to fully utilize the potential to benefit their students. The U-Pace instructional approach uses information about learner engagement and performance recorded in the institution’s LMS to maximize students’ learning experience and provide personalized support for students to be successful.
What does U-Pace mean for instructors? U-Pace is a self-paced, mastery-based online instructional approach that works within any LMS. U-Pace proactively supports learners through instructor-initiated messages called Amplified Assistance.
The mastery-based learning component of U-Pace consists of course content divided into small, manageable units (usually half of a chapter/lesson) that are each associated with a 10-item quiz. Students must demonstrate mastery on each unit quiz by scoring at least 90% before they can advance to new content. Retakes are unlimited (with a required one-hour wait between attempts), and consist of different quizzes that cover the same content.
Amplified Assistance consists of tailored feedback and motivational support that is emailed at least weekly to each student, which may be particularly useful for students who are struggling but reluctant to ask for help. Instructors use information recorded in the LMS to craft Amplified Assistance messages personalized for the student. Valuable information provided by most LMS’s includes:
When was the last time the student took a quiz or accessed the course material?
How many attempts does the student require to demonstrate mastery on a quiz?
Are students missing questions related to one particular concept that the instructor can help clarify?
Are students missing questions from multiple different content areas, perhaps suggesting they need assistance with their study skills and general approach to learning the material?
How does Amplified Assistance help students? In Amplified Assistance messages, instructors communicate unwavering belief in the student’s ability to succeed, and praise the student for small accomplishments (such as mastering a single quiz). Instructors also reinforce students’ effort and persistence (for example, by praising a student for consistently making attempts at a quiz they have found challenging to master), which may be especially beneficial for students who have the tendency to give up after minor set-backs. By focusing on the student’s positive behavior, instructors are shaping the student’s behavior for success. Through Amplified Assistance messages, U-Pace instructors provide the support students need to meet the high standards created by U-Pace’s mastery-based learning component, a combination which empowers students and fosters their sense of control over learning.
How can instructors create Amplified Assistance messages efficiently? Past U-Pace instructors have field-tested dozens of Amplified Assistance messages and created templates that are freely available on the U-Pace website. The variety of templates offered allows instructors to select a message from an appropriate category (e.g., “Students who are on schedule,” “Students who are behind schedule,” or “Students who have not started”) and then tailor each message based on the individual student’s performance. These templates reduce the time needed for instructors to compose effective messages to address student needs, while still offering instructors the flexibility to craft personalized messages that will be meaningful and build rapport with each student.
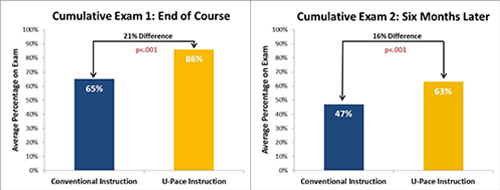
DoesU-Pace produce results? The U-Pace instructional approach has been honored with a 2014 WCET Outstanding Work (WOW) Award. U-Pace instruction produced striking student success in multiple rigorous evaluations, including a large randomized controlled trial (where learners did not self-select their course format) funded by the U.S. Department of Education, Institute of Education Sciences, and a multi-institutional study funded by EDUCAUSE’s Next Generation Learning Challenges program. U-Pace has consistently produced greater learning and greater academic success compared to conventional face-to-face instruction. U-Pace students have scored higher than conventionally taught students on proctored, cumulative exams taken at the end of the course, and again six months later (EDUCAUSE Review Online). A greater percentage of U-Pace students (compared to conventionally taught students) have earned final grades of A or B (EDUCAUSE Learning Initiative Case Study). Furthermore, U-Pace students have shown improvements in self-regulated learning, as evidenced by a decrease in the number of attempts needed to master the quizzes over the course of the semester (Journal of Asynchronous Learning Networks).
How do students react to U-Pace instruction? Survey data has found that, relative to conventionally taught students, U-Pace students perceive greater instructor support, control over their learning, and improvements in time management and study skills over the semester (NGLC Grantee Profile, Journal of Asynchronous Learning Networks). Student reviews have mirrored these findings:
“I am actually retaining the information that I learned in this course. It has helped me out so much in boosting my confidence, and actually showing me, and opening the door, and saying you are just a step further from graduation and you can succeed because you have all these skills in you that you might have never seen before.”
“I go out and try new things, and I know that that sounds really weird, that a course can change someone like that, but you know that it is, I learned the content as well, but it is not even that, it is the fact that I am learning to be myself more, and I am opening up more doors to being motivated and having better time managing skills and being more confident in myself. Outside of school, people have noticed changes in me, that I have more of a glow to me, that I am more outgoing, almost because I have that confidence that I can actually do stuff that I used to think I had no business doing.”
Bottom line.By acting upon student data recorded in the LMS, instructors can have a meaningful impact on students. U-Pace is an empirically-tested instructional approach that has shown great success in utilizing this data to motivate, engage, and improve the learning of students. By integrating the U-Pace instructional method with LMS capabilities, instructors have the opportunity to maximize the value of these tools for guiding students to success.
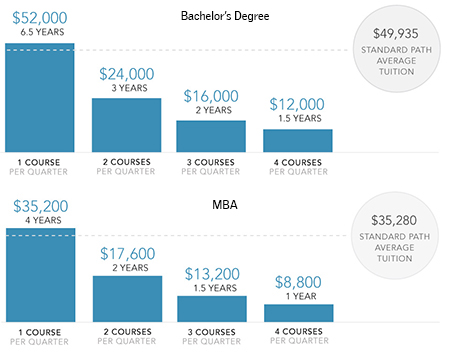
Today we welcome Colorado Technical University Chief Academic Officer and Provost, Connie Johnson and CTU faculty member, Sarah Pingrey as they share what their WCET Outstanding Work (WOW) award-winning program has done to improve the student and faculty experience in MBA-preparatory courses.
One of the great pleasures that I have as Chief Academic Officer of Colorado Technical University, is to work with a large group of talented faculty who embrace new technology to improve student learning. In 2012, CTU committed to creating a personalized learning experience for our students.
Because CTU has many adult students pursuing an MBA degree that may have an undergraduate degree in other disciplines, University Dean of Business, Dr. Gail Whitaker worked with the business program committee to integrate adaptive learning into business pre-requisites. The purpose was two-fold: to ensure that students received the content that he or she specifically needed as a knowledge-base for the MBA program and to comply with prerequisite requirements prescribed by Association Council for Business Schools and Programs (ACBSP). This innovative approach, which CTU received the WCET Outstanding Work award for, provided students with a tailored learning path for topics including accounting, statistics, economics and finance.
Central to the implementation of adaptive learning technology (Intellipath) were faculty who created relevant assessments and content for each course. Intellipath provides content to students determined by an assessment and provides instructors with the ability to work with students.
The Faculty Experience
Sarah Pingrey, faculty member at CTU, shares her experience using the platform:
I started working on the adaptive learning platform Intellipath at CTU in the spring of 2012. From development to testing to piloting courses to full implementation, I’ve seen Intellipath grow into an essential learning platform for students. Throughout my teaching career other platforms have tried to woo me, but Intellipath does something different – faculty members are intimately involved in their students’ progress every step of the way.
Teaching in an Intellipath classroom is such a joyful experience. Training is simple with videos and documents to review and a short quiz to demonstrate competency. Once training is complete and fundamental best practices are understood, the next step is to delve deeper into exactly what Intellipath offers and how to access and use this information. With so many students entering the classroom who are scared that mathematics will be the end of their college careers, I am to be able to follow their progress through the course objectives, praise their successes, and help them immediately when they struggle. Intellipath gives me the information I need to do this and there is no way a student can fall behind without me knowing.
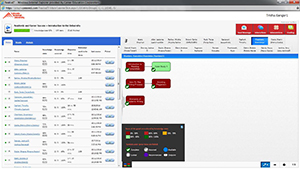
Intellipath contains detailed data for the entire class and for each student, and using this data effectively is crucial. The first thing I want to know is whether a student has started working on their weekly assignments. Intellipath clearly shows which students have started or completed the assignment. Also, it only takes a quick glance to find a student’s current knowledge score on the assignment, the number of objectives completed, the time spent working on the assignment, and the day that the assignment was last accessed. This information is such a treat for an instructor to have. Instructors can now motivate students who have not started the assignment and give praise to those who have.
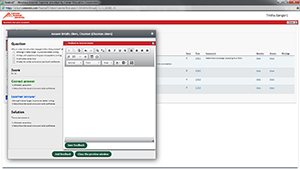
Students can also easily flag difficult problems. A detailed solution is provided to every problem, but if a student doesn’t understand the solution or has a question, they can easily flag the problem by just pushing a button. The problem, the student’s solution, and the scratch work can be viewed, and I am able to leave feedback for the student. Encouraging students to use this feature is crucial and students are very likely to use it since they are able to ask questions without having to directly email the instructor: pushing a button is easy.
Intellipath has definitely led to more interaction between students and faculty. It has also changed the dynamics of synchronous lectures. Having the lectures apply to all students can be challenging when some students have already started their Intellipath assignments and have very specific questions, while other students don’t have enough foundational knowledge yet to jump into answering these questions. Having organized slides and corresponding class activities, and being able to jump around in them during the lecture, makes teaching more effective for both students and faculty.
The biggest challenge for an online professor can be making that initial connection with students. Students are struggling, but what they are struggling with is unknown until it is too late. Intellipath takes away the mystery of why a student is struggling and makes interactions between the instructor and student easy, fun, and often. I am excited for the future of Intellipath, and most of all, excited that students are truly learning!
Capella University is a 2014 WCET Outstanding Work (WOW) Award recipient for the development of FlexPath. Deb Bushway, Vice President of Academic Innovation and Chief Academic Officer shares with us today the evolution of FlexPath from pilot to celebrating its first birthday as a program. Capella will accept their award at the WCET 26th Annual Meeting.
In May 2012, Capella University’s academic leadership made the decision to delve into the world of direct assessment. The impetus for our pursuit of designing a direct assessment program came from a conversation with leaders at the U.S. Department of Education regarding barriers to innovation. They recommended that we leverage the Federal Department of Education’s Title IV eligibility language introduced in August 2006, and finalized by the department in November of that same year to explore our options for introducing direct assessment programs. As the process rolled out, it became clear that we also needed to acquire approval from our regional accreditor, the Higher Learning Commission, to begin development of direct assessment courses citing this portion of the Title IV.
It is important to note that all curricula at Capella University are competency based. These academic programs are still rooted in courses and comply with seat time (and other) requirements for credit bearing distance education. This curricular base provided a great starting place to move to a competency-based, direct assessment delivery model.
The Self-Paced Course Pilot
Initially, we started with a pilot to help us understand the learning experience in a self-paced delivery model. The initiative was simply referred to as the Self-Paced Course Pilot. We based these courses on the infrastructure built to support our credit-bearing programs. From the onset of design and development of these courses, we have taken a very faculty-driven design and delivery approach. The faculty chairs from both programs worked directly with our instructional designers, curriculum specialists, assessment specialists, and project managers as we built a self-paced course experience that would be as rigorous and engaging as our more “traditional” online credit-bearing model. The team worked very closely together for many months with a goal of offering four courses from each of the two programs in early January 2013.
Support Structures for Learners
Concurrently, we built out a support structure for our learners to be able to achieve the necessary competencies to successfully complete each course in a self-paced format. After countless meetings with faculty, advising staff, and a host of other contributors, we arrived at a three-pronged support structure. This learner support structure consists of traditional faculty, tutoring faculty, and coaching faculty. In traditional credit-bearing delivery models, these three support roles are often integrated into the work of a single faculty member. With this new architecture of the faculty role, extensive training was necessary for the individuals who took on these new functions.
Capella faculty chairs chose select faculty members from our traditional programs to pilot this new approach to teaching and learning. These faculty members then led the work to articulate competencies, align the criteria through which to assess competencies, design the authentic assessments, and serve as the evaluators of learners’ demonstration of competency. The tutoring faculty are aligned to particular “clusters of competency” (or courses) and are content area experts. Many are enrolled in our doctoral programs at Capella University and have demonstrated success in the relevant content area. One reason for this design is that our research indicates adult learners prefer seeking help from peers rather than the traditional faculty. Finally, the coaching faculty team was formed. This team came from among our traditional advising teams, although this model is significantly more proactive and engaged than the traditional advising model. Each learner is assigned a coaching faculty member who stays with that individual throughout his/her experience at Capella.
Aligning the Technology
The third major component in developing FlexPath was to align Capella’s technology infrastructure to accommodate the needs of a competency-based direct assessment delivery model. There are many unique attributes to FlexPath that our systems simply were not designed to accommodate. These attributes range from not having any course level grades to not being able to transcribe individual competencies for each course. Other technological areas needing alterations included our learning management system, our institution’s learner website (iGuide), and our student administration system. We needed to accommodate these attributes without making permanent changes to our systems, not knowing if the direct assessment delivery model would be accepted widely enough to make permanent changes a worthwhile endeavor. Additionally, the university’s catalog, policy, and external communications needed to reflect all of the changes needed to deliver FlexPath. The entire initiative took dozens of people and thousands of hours’ worth of work before a single learner was enrolled into a FlexPath course!
Celebrating Successes & Expanding to the Future
All in all, FlexPath has been and continues to be an exciting endeavor. We have been honored with several awards for our efforts, most notably, the WOW Award from WCET, along with Blackboard Learning’s Innovation Award and the NUTN Award for Innovation in Distance Education.
FlexPath will soon be celebrating its first birthday. There are now a total of six degree programs offered in the FlexPath model. As the FlexPath program expands, so does our knowledge base for developing high-quality, competency-based direct assessment programs. With that said, we identify opportunities to enhance FlexPath on a daily basis. As more and more universities take on the challenge of implementing this type of program, we look forward to the opportunity to participate in a larger community of practice around direct assessment to further address the needs of 21st century adult learners and employers.
Katie Blot, senior vice president, education services at Blackboard shares with us how MyEdu is helping learners succeed through academic planning and out into the marketplace.
When we talk about changes in education, the best place to start is with the learner. And if there’s one statistic that highlights the shift in who our learners are, it could be this: today less than 15 percent of higher education students in the U.S. are what we would call “traditional” 4-year residential students. That means that there are roughly 18 million post-traditional students who are over 25, need to work to afford education, attend multiple institutions, have dependents, and are actively working toward job and career goals.
Even “traditional” undergraduates are seeking flexibility and transparency in their educational options (online, self-paced, dual enrollment, accelerated degrees, competency based learning, etc.), such that the old distinctions between “traditional” and “non-traditional” are not really applicable anymore. Post-traditional students do not fit in clearly defined categories, and they follow extremely varied educational pathways.
Economics Make Students More Focused on Their Goals
These shifts are driven in part by economics. The need for higher education opportunities is greater than ever before, as increasingly jobs require post-secondary education. Research repeatedly emphasizes that higher education leads to greater economic attainment, both for individuals and for our country. But with the recession and the rise in the cost of higher education, degree attainment is extremely difficult for many people to afford. Potential students are looking for a more economical means to access upward mobility and are accelerating huge consumer-driven changes in higher education.
Students today are much more focused on establishing a clear-cut career path and figuring out which job is going to help them earn a living and eventually pay for or justify the cost of their education. This leads to a focus on the competencies they’ll gain from their education and how they can demonstrate those competencies to prospective employers and translate them into gainful employment.
What Do College and University Presidents Foresee? It’s Not Always Positive.
Naturally, these shifts in learner behavior put significant pressure on our institutions. But educational institutions, even in their own estimation, are not adapting quickly enough. Our recent research co-sponsored by The Chronicle of Higher Education gathered insights from over 350 college and university presidents on the topics of change and innovation in higher education.
Nearly 70% of presidents believe that at least a moderate amount of disruption is needed in higher education.
63% of presidents believe that the pace of change is too slow.
While 60% of respondents are optimistic about the direction the American higher education system is going in, only 30% felt as if the higher education system is currently the best in the world. Surprisingly, this drops to 17 percent when asked about the next decade.
And less than half (49%) of the Presidents believed we are providing good or excellent value to students and their families.
How will we approach systemic educational changes? We’ve been talking for a while about mobile, personal, and flexible – but that is not enough. Now we need to add affordable, modular, and accessible. The learning ecosystems that serve these needs empower students to:
See at a glance what’s happening, what they’ve accomplished, and what should be next.
Access learning materials anytime, anyplace, including diverse personalized learning resources.
Collaborate in learning activities while forming communities of peers and mentors.
Easily create learning artifacts and reflect on their own learning.
Collect portable evidence of learning.
Manage competencies and learning achievements from multiple sources.
Develop an online academic and professional identity.
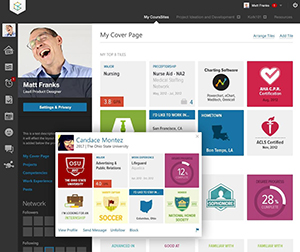
MyEdu: A New Academic Planning Tool
One example of how Blackboard is helping learners succeed is MyEdu. MyEdu offers free, learner-centric academic planning tools, including a personal education planner, a flexible scheduler and an assignment tracker. By consolidating multiple components into a rich, easy-to-use platform, MyEdu helps students plan their degree path, take the right classes, and stay on track to graduate on time. MyEdu also presents students with up-to-date information about courses, schedules, and professors as well as feedback from other students.
MyEdu helps learners establish their professional profiles. The traditional resume doesn’t accurately represent the skills and talents of learners, and tools that work for mid-career professionals don’t effectively convey a student’s credentials, capabilities, and evidence of learning. As students use MyEdu’s academic tools, they build their professional profiles with data about their school, major, courses, graduation date and academic work. They can also personalize their profiles with credentials, projects, organizations, services, languages, work experiences and competencies, providing valuable information to employers.
And perhaps most importantly, MyEdu connects learners with employers and jobs. Learners choose how much and what type of information from their profiles to show to employers for potential jobs and internships. By connecting the learning achievements from their courses and projects with lifelong, cross-institutional learning profiles, these achievements and their related competencies become more powerful for helping learners succeed in their goals of completing their degrees, getting jobs, and advancing their careers. MyEdu empowers learners to recognize, manage and continuously build on their own recognizable achievements beyond any single course, program, degree, or institution.
MyEdu enables employers to connect directly to students whose data indicates that they would be a great match for open positions. They can see not only courses and credits, but also much more granular achievements that reveal who the student is and what specific talents they can bring to the job. These are very concrete ways in which new technologies and evolving learning ecosystems serve post-traditional learners.
It’s not just about jobs—it’s the new normal of evolving careers and the need for lifelong learning. Today’s learners need to build skills and work toward credentials at any time, at any age and apply them to an ever-changing landscape of personal goals. Today’s evolutions in our learning ecosystems coincide with the rise in learners’ need to have more control over their own learning achievements.
After billions of dollars spent on administrative computer systems and billions of dollars invested in ed tech companies, the U.S. higher education system is woefully out of date and unable to cope with major education trends such as online & hybrid education, flexible terms, and the expansion of continuing and extended education. Based on an investigation of the recently released distance education data for IPEDS, the primary national education database maintained by the National Center for Education Statistics (NCES), we have found significant confusion over basic definitions of terms, manual gathering of data outside of the computer systems designed to collect data, and, due to confusion over which students to include in IPEDS data, the systematic non-reporting of large numbers of degree-seeking students.
In Fall 2012, the IPEDS (Integrated Postsecondary Education Data System) data collection for the first time included distance education – primarily for online courses and programs. This data is important for policy makers and institutional enrollment management as well as for the companies serving the higher education market.
We first noticed the discrepancies based on feedback from analysis that we have both included at the e-Literate and WCET blogs. One of the most troubling calls came from a state university representative that said that the school has never reported any students who took their credit bearing courses through their self-supported, continuing education program. Since they did not include the enrollments in reporting to the state, they did not report those enrollments to IPEDS. These were credits toward degrees and certificate programs offered by the university and therefore should have been included in IPEDS reporting based on the following instructions.
Calculating distance education enrollments hit some major snags.
“Include all students enrolled for credit (courses or programs that can be applied towards the requirements for a postsecondary degree, diploma, certificate, or other formal award), regardless of whether or not they are seeking a degree or certificate.”
Unfortunately, the instructions call out this confusing exclusion (one example out of four)
“Exclude students who are not enrolled for credit. For example, exclude: Students enrolled exclusively in Continuing Education Units (CEUs)”
How many schools have interpreted this continuing education exclusion to apply to all continuing education enrollments? To do an initial check, we contacted several campuses in the California State University system and were told that all IPEDS reporting was handled at the system level. Based on the introduction of the Fall 2012 distance education changes, Cal State re-evaluated whether to change their reporting policy. A system spokesman explained that:
“I’ve spoken with our analytic studies staff and they’ve indicated that the standard practice for data reporting has been to share only data for state-supported enrollments. We have not been asked by IPEDS to do otherwise so when we report distance learning data next spring, we plan on once again sharing only state-supported students.”
Within the Cal State system, this means that more than 50,000 students taking for-credit self-support courses will not be reported, and this student group has never been reported.
One of the reasons for the confusion, as well as the significance of this change, is that continuing education units have moved past their roots of offering CEUs and non-credit courses for the general public (hence the name continuing education) and taking up a new role of offering courses not funded by the state (hence self-support). Since these courses and programs are not state funded, they are not subject to the same oversight and restrictions as state-funded equivalents such as maximum tuition per credit hour.
This situation allows continuing education units in public schools to become laboratories and innovators in online education. The flip side is that given the non-state-funded nature of these courses and programs, it appears that schools may not be reporting these for-credit enrollments through IPEDS, whether or not the students were in online courses. However, the changes in distance education reporting may actually trigger changes in reporting.
Did Other Colleges Also Omit Students from Their IPEDS Report?
Given what was learned from the California State University System, we were interested in learning if other colleges were having similar problems with reporting distance education enrollments to IPEDS. WCET conducted a non-scientific canvassing of colleges to get their feedback on what problems they may have encountered. Twenty-one institutions were selected through a non-scientific process of identifying colleges that reported enrollment figures that seemed incongruous with their size or distance education operations. See the “Appendix A: Methodology” (Link added after publishing) for more details.
From early August to mid-September, we sought answers regarding whether the colleges reported all for-credit distance education and online enrollments for Fall 2012. If they did not, we asked about the size of the undercount and why some enrollments were not reported.
Typically, the response included some back-and-forth between the institutional research and distance education units at each college. Through these conversations, we quickly realized that we should have asked a question about the U.S. Department of Education’s definition of “distance education.” Institutions were very unclear about what activities to include or exclude in their counts. Some used local definitions that varied from the federal expectations. As a result, we asked that question as often as we could.
The Responses
Twenty institutions provided useable responses. We agreed to keep responses confidential. Table 1 provides a very high level summary of the responses to the following two questions:
Counts Correct? – Do the IPEDS data reported include all for-credit distance education and online enrollments for Fall 2012?
Problem with “Distance Education” Definition? – Although we did not specifically ask this question, several people volunteered that they had trouble applying the IPEDS definition.
Table 1: Counts for Institutional Responses
Counts Correct?
Problem with “Distance Education” Definition?
Yes
11
3
Maybe
5
5
No
4
12
One institution declined to respond. Given that its website advertises many hundreds of online courses, the distance education counts reported would leave us to believe that they either: a) under-reported, or b) average one or two students per online class. The second scenario seems unlikely.
Of those that assured us that they submitted the correct distance education counts, some of them also reported having used their own definitions or processes for distance education. This would make their reported counts incomparable to the vast majority of others reporting.
Findings
This analysis found several issues that call into question the usability of IPEDS distance education enrollment counts and, more broadly and more disturbingly, IPEDS statistics, in general.
There is a large undercount of distance education students
While only a few institutions reported an undercount, one was from the California State University System and another from a large university system in another populous state. Since the same procedures were used within each system, there are a few hundred thousand students who were not counted in just those two systems.
In California, they have never reported students enrolled in Continuing Education (self-support) units to IPEDS. A source of the problem may be in the survey instructions. Respondents are asked to exclude: “Students enrolled exclusively in Continuing Education Units (CEUs).” The intent of this statement is to exclude those taking only non-credit courses. It is conceivable that some might misinterpret this to mean to exclude those in the campuses continuing education division. What was supposed to be reported was the number of students taking for-credit courses regardless of what college or institutional unit was responsible for offering the course.
In the other large system, they do not report out-of-state students as they do not receive funding from the state coffers.
It is unclear what the numeric scope would be if we knew the actual numbers across all institutions. Given that the total number of “students enrolled exclusively in distance education courses” for Fall 2012 was 2,653,426, an undercount of a hundred thousand students just from these two systems would be a 4% error. That percentage is attention-getting on its own.
The IPEDS methodology does not work for innovative programs…and this will only get worse
Because it uses as many as 28 start dates for courses, one institutional respondent estimated that there was approximately a 40% undercount in its reported enrollments. A student completing a full complement of courses in a 15-week period might not be enrolled in all of those courses at the census date. With the increased use of competency-based programs, adaptive learning, and innovations still on the drawing board, it is conceivable that the census dates used by an institution (IPEDS gives some options) might not serve every type of educational offering.
The definition of ‘distance education’ is causing confusion
It is impossible to get an accurate count of anything if there is not a clear understanding of what should or should not be included in the count. The definition of a “distance education course” from the IPEDS Glossary is:
“A course in which the instructional content is delivered exclusively via distance education. Requirements for coming to campus for orientation, testing, or academic support services do not exclude a course from being classified as distance education.”
Even with that definition, colleges faced problems with counting ‘blended’ or ‘hybrid’ courses. What percentage of a course needs to be offered at a distance to be counted in the federal report? Some colleges had their own standard (or one prescribed by the state) with the percentage to be labeled a “distance education” course varied greatly. One reported that it included all courses with more than 50% of the course being offered at a distance.
To clarify the federal definition, one college said they called the IPEDS help desk. After escalating the issue to a second line manager, they were still unclear on exactly how to apply the definition.
The Online Learning Consortium is updating their distance education definitions. Their current work could inform IPEDs on possible definitions, but probably contains too many categories for such wide-spread data gathering.
There is a large overcount of distance education students
Because many colleges used their own definition, there is a massive overcount of distance education. At least, it is an overcount relative to the current IPEDS definition. This raises the question, is the near 100% standard imposed by that definition useful in interpreting activity in this mode of instruction? Is it the correct standard since no one else seems to use it?
In addressing the anomalies, IPEDS reporting becomes burdensome or the problems ignored
In decentralized institutions or in institutions with “self-support” units that operate independently from the rest of campus, their data systems are often not connected. They are also faced with simultaneously having to reconcile differing “distance education” definitions. One choice for institutional researchers is to knit together numbers from incompatible data systems and/or with differing definitions. Often by hand. To their credit, institutional researchers overcome many such obstacles. Whether it is through misunderstanding the requirements or not having the ability to perform the work, some colleges did not tackle this burdensome task.
Conclusions – We Don’t Know
While these analyses have shed light on the subject, we are still left with the feeling that we don’t know what we don’t know. In brief the biggest finding is that we do not know what we do not know and bring to mind former Secretary of Defense Donald Rumsfeld’s famous rambling:
“There are known knowns. These are things we know that we know. We also know there are known unknowns. That is to say, there are things that we know we don’t know. But there are also unknown unknowns. There are ones we don’t know we don’t know.”
The net effect is not known
Some institutions reported accurately, some overcounted, some undercounted, some did both at the same time. What should the actual count be?
We don’t know.
The 2012 numbers are not a credible baseline
The distance education field looked forward to the 2012 Fall Enrollment statistics with distance education numbers as a welcomed baseline to the size and growth of this mode of instruction. That is not possible and the problems will persist with the 2013 Fall Enrollment report when those numbers are released. These problems can be fixed, but it will take work. When can we get a credible baseline?
We don’t know.
A large number of students have not been included on ANY IPEDS survey, EVER.
A bigger issue for the U.S. Department of Education goes well beyond the laser-focused issue of distance education enrollments. Our findings indicate that there are hundreds of thousands of students who have never been reported on any IPEDS survey that has ever been conducted. What is the impact on IPEDS? What is the impact on the states where they systematically underreported large numbers of students?
We don’t know.
Who is at fault?
Everybody and nobody. IPEDS is faced with institutional practices that vary greatly and often change from year-to-year as innovations are introduced. Institutional researchers are faced with reporting requirements that vary depending on the need, such as state oversight agencies, IPEDS, accrediting agencies, external surveys and ranking services, and internal pressures from the marketing and public relations staffs. They do the best they can in a difficult situation. Meanwhile, we are in an environment in which innovations may no longer fit into classic definitional measurement boxes.
What to expect?
In the end, this expansion of data from NCES through the IPEDS database is a worthwhile effort in our opinion, and we should see greater usage of real data to support policy decisions and market decisions thanks to this effort. However, we recommend the following:
The data changes from the Fall 2012 to Fall 2013 reporting periods will include significant changes in methodology from participating institutions. Assuming that we get improved definitions over time, there will also be changes in reporting methodology at least through Fall 2015. Therefore we recommend analysts and policy-makers not put too much credence in year-over-year changes for the first two or three years.
The most immediate improvement available is for NCES to clarify and gain broader consensus on the distance education definitions. This process should include working with accrediting agencies, whose own definitions influence school reporting, as well as leading colleges and universities with extensive online experience.
NOTE: The research on the IPEDS survey and this blog post are the result of an on-going partnership between Phil Hill (e-literate blog and co-founder of MindWires Consulting, @PhilonEdTech) and WCET. Throughout this year, we coordinated in analyzing and reporting on the IPEDS Fall Enrollment 2012 distance education enrollment data. As they came to light, we also coordinated in examining the anomalies. We very much appreciate Phil and this partnership.
Much thanks goes to Terri Taylor Straut, who performed the heavy lifting for WCET in surveying institutions and conducting follow-up calls with respondents. Her insightful questions and attention to details was invaluable. And thank you to Cali Morrison, WCET, for her work in helping us to get the word out about our findings. Russ Poulin
Russell Poulin
Interim Co-Executive Director
WCET – WICHE Cooperative for Educational Technologies rpoulin@wiche.edu
Twitter: @RussPoulin
The Excelsior College Online Writing Lab (OWL) is a 2014 recipient of the WCET Outstanding Work (WOW) Award and will accept the award at the WCET Annual Meeting. Today Crystal Sands, Director of the OWL shares with us the goals, process and results of a pilot study on the OWL’s use that resulted in their award.
We knew we wanted our Online Writing Lab (OWL) to stand out, to be more student friendly than other online writing resources, and to use some of the latest research about what works in writing instruction and in online education. It turned out to be a monumental task; we had just one year to build it. But, the Excelsior College Online Writing Lab was a labor of love for all of us, and I think it shows.
The Excelsior College OWL is a first-of-its-kind, open-source multimedia online writing lab. While we continue to expand its resources, the OWL already provides comprehensive writing support for students across eight areas:
Paper Capers is an original writing process video game, allowing students to practice writing process steps and build a writer’s vocabulary, which is essential for skill transfer. The game also features mini assessments, allowing students to practice lessons from the other areas of the OWL.
Funding for building this kind of comprehensive support was generously provided by the Kresge Foundation. To fit within the funding criteria, our team worked quickly to build the OWL, completing it in just one year. During the second year of the grant, we conducted a national pilot study and based revisions upon feedback from the study.
Creating the OWL
Excelsior College worked with one writing faculty member from each of its five community college partners to develop specific goals for the OWL. We knew we wanted to create an OWL that was different than other online writing labs, one that was student-centered, warm, and engaging. We wanted to make the OWL a fun learning experience, a place that students would come back to even after their writing class was over. We decided to focus on helping students build a strong writing process, as research indicates that students who have a better writing process also have better writing products. We also needed to help students build a rhetorical foundation and vocabulary, which would assist them in becoming more flexible writers. As part of the creation of OWL, a writing video game was created to reinforce both the writing process and a rhetorical foundation.
As director, my job was to develop content based on feedback from the committee and try to imagine how the content could be brought to life for students. An instructional designer was critical in that process. Additionally, we worked with an outside vendor, who was committed to our idea to do something creative and fun, on the website build and design. The brainstorming sessions we had were remarkable at times, and it was not long before we were seeing our ideas become reality.
As we neared the end of the first year of the project, we realized we were doing more than we had originally envisioned in the scope of the grant—adding new content, additional areas, and working to add a creative flair to the OWL. The hours were long, but our committed, small team got the OWL ready for the pilot study, which was to begin in the fall of 2013.
The summer of 2013 was an epic time. As the project director, I was responsible for making sure deadlines were met and budgets were kept. Thankfully, we had a wonderful grants office that supported me and our team in this endeavor. My family also became involved in the project as well, with my husband providing audio, and when testing on the site began my high school-aged son joined us in the testing as well. The OWL became our dinner-time conversation, and when my toddler asked me, “Mama, what is a thesis statement?” I knew I had probably crossed that work-life balance line. I knew I was not alone in crossing that line, as our team of five went above and beyond that summer. Thankfully, we were just about ready for the pilot study.
It truly was a labor of love. I don’t think we could have built such a resource in such a short time otherwise. Fortunately, our hard work has been rewarded.
The Pilot Study
Thanks to an amazing team effort, the OWL was ready to go, minus a few tweaks, for the pilot study. Our team of teachers from our partner colleges worked together to build the OWL into the curriculum of their writing classes. We ran treatment and control group classes in order to have sets of students working with the same curriculum without the added support of the OWL. The results were positive and gave us a good start on future study of the OWL and how it benefits students.
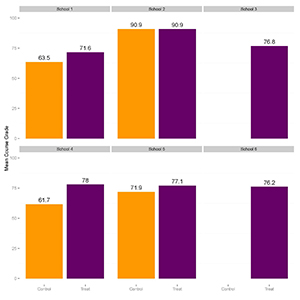
We found that students in the treatment groups, who used the OWL regularly, scored 6.6 points higher on their final grades than students in the control groups. We also ran a “writing about writing” assessment in order to evaluate how students approached the writing process. In six of the seven categories we assessed, students in the treatment groups exhibited more growth than students in the control groups. In our assessment of the final product essays, something we knew would be tricky, as it is difficult to show improvement in just one semester, we had positive results as well. Students in the treatment groups exhibited more growth in three of the five categories we assessed, showing greater improvement in context and purpose for writing, control of syntax and mechanics, and genre and disciplinary conventions.
Students also completed extensive surveys on the OWL and their attitudes toward writing at the beginning and end of the semester. Students responded well to the OWL, reporting that the content felt relevant and helpful. Students in the treatment groups also reported greater improvements in their general attitudes about writing, with many students indicating they were more likely to write in their spare time after using the OWL.
These results are promising and are in line with the goals of the OWL. While longitudinal study is needed, we have evidence that the Excelsior College OWL provides students with a strong foundation in writing, one that is going to help them transfer the skills they learn in writing classes to other writing situations, which is, of course, the ultimate goal of writing instruction.
The OWL team at Excelsior College feels we have set the stage, through solid writing instruction and extensive multimedia support, to be the kind of free resource that students can rely upon and come back to, throughout their college careers and beyond.
Our team has been honored with the WCET Outstanding Work Award. We are excited that high schools, community colleges, and universities across the country are beginning to use the OWL in their classes and their writing centers. We have been successful in our goals to create a warm, engaging learning environment. The structure of the OWL makes it a valuable resource, whether students need one short lesson on documentation or extensive instruction in writing support. There is something for everyone in the OWL!
Crystal Sands, Director
Online Writing Lab (OWL)
Excelsior College
Our WICHE Colleague, Patrick Lane, senior policy analyst and the project coordinator for the Adult College Completion Network, shares with us today a recap, originally posted on the ACCN blog, of what the Starbucks-ASU partnership means for employees and how for many of them, as adult students with many commitments, there are still barriers the program doesn’t address.
The Starbucks-Arizona State University (ASU) partnership that will provide tuition reimbursement for employees in their last two years of postsecondary education garnered a good deal of press recently. The program has many interesting components that will benefit a broad range of students who are employed by Starbucks, but this post focuses on the implications of this new program for adults with prior college credit but no degree. Looking more closely at the agreement highlights the importance of several policies and practices that can be barriers to adult degree completion.
First, here’s a quick recap of the benefit, which is linked to ASU’s online program, and what it offers to Starbucks employees:
Employees who work at least 20 hours per week and have at least 56 credits accepted by ASU are eligible for College Achievement Plan (CAP) reimbursements to cover tuition and fees. Starbucks will reimburse them after accounting for federal financial aid, military benefits, and institutional financial aid.
ASU will give enrolled employees a “CAP Scholarship” that effectively reduces employees’ tuition.
Eligible employees will receive reimbursements after completing certain academic milestones. As envisioned, reimbursements would come after students reach 21-credit “milestones.”
Employees will be required to complete a Free Application for Federal Student Aid (FAFSA).
None of the baristas in Bozeman are taking advantage of the ASU program yet, but they had heard of it.
Starbucks certainly deserves commendation for making an aggressive move to support employee education, regardless of whether or not it benefits the company’s bottom line. (Some research shows that tuition reimbursement programs can have a positive return on investment mainly due to lower recruitment costs and increased retention, but typically those programs have a smaller overall reimbursement than imagined here.)
Still, like many other tuition reimbursement programs, the Starbucks-ASU program presents some barriers for potential returning students, but also highlights some promising strategies.
The up-front costs for students will be high. If employees only receive reimbursements each time they complete 21-credit chunks, they will be on the hook for a portion of tuition and fees even after accounting for Pell grants and other sources of financial aid. This burden will likely reduce the number of Starbucks employees who take advantage of the benefit. The Council for Adult and Experiential Learning (CAEL) has found that eligible employees are much more likely to take advantage of tuition assistance programs when those benefits are prepaid compared to when they are on a reimbursement basis. Their research shows participation in prepaid programs at 14 percent of eligible employees compared to 5 percent for reimbursement-based programs.
Starbucks – and other employers offering tuition reimbursements – could reduce this burden by converting the program to “tuition assistance” that is distributed when the employee has to pay his or her tuition bill. Other incentives or mechanisms to require repayment if the employee does not complete the milestone could be put in place to achieve the same ends without unduly burdening the employee.
Coaching can pay off. Part of the arrangement calls for Starbucks to pay for students’ retention coaches. Research on coaching – which typically involves intensive advising focused on managing commitments within and outside of postsecondary education, navigating the college bureaucracy, and focusing on post-graduation career goals – has shown some evidence of success, with students who receive coaching being more likely to persist and graduate.
Evaluation of transfer credit is crucial. It is probably safe to assume that many of the Starbucks employees hoping to take advantage of the program have earned college credit at institutions other than Arizona State University. Like many other non-traditional students enrolling at a new institution, the amount of time they will need to spend to finish their degree will depend a great deal on how their transfer credit is evaluated and applied (or not) toward a major. Rejecting credits or granting only elective or general education credits can cause returning adults to spend significant extra time finishing a degree.
Competing demands on students’ time may make completion difficult. Some of the press commentary and critiques have noted that employees working 20 hours a week or more may find that it is difficult to fit in the necessary coursework to finish a degree. This is hardly news for those who work with adult students, and not really a valid critique of Starbucks’ benefit, but more a reflection on what working adults returning to college regularly face. Generally speaking, institutions can adopt policies and practices that make it easier to manage these demands, such as advising options outside of business hours, having business and financial aid offices open longer hours, or providing “concierges” to help guide students through the difficult process of reenrolling. As an example, ASU provides ways for students to talk with financial aid staff 24/7.
Overall, Starbucks’ offering has (for the moment) shined a bright spotlight on the challenges faced by adult students, as well as some of the promising strategies to help them succeed. It will be interesting to watch to see whether other companies begin to adopt similar programs and to what extent this affects the broader landscape of adult education.
We use cookies to ensure that we give you the best experience on our website. If you continue to use this site we will assume that you are happy with it.OK
 We developed our OER-Based Associate Degree Project to be delivered online, so that any student at any NOVA campus could have the opportunity to take these courses. Our online students are familiar with technology and find having OER embedded into their online courses conducive to their learning.
 Wm. Preston Davis, Ed.D.
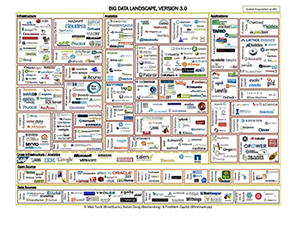
 lopment. Purdue University’s Signals was among the first examples of using predictive analytics to identify students at risk, using a simple green – orange – red color scheme to flag students according to their risk probabilities. Sinclair College’s Student Success Plan provided early predictive case management support in the category for what is now emerging as Integrated Planning and Advising Systems (IPAS) tools and platforms. Rio Salado College used their PACE system to anticipate students at risk. Austin Peay University’s Degree Compass gave people an Amazon-like experience for course selection. Institutions including the American Public University System and the University of Phoenix made significant advancements in building sophisticated predictive analytics models to find students at risk. But it was the Bill & Melinda Gates Foundation’s investments in action analytics which helped jump-start and sustain multiple initiatives focused on building capacity to support using data to support and enable decision-making. In the post-secondary educational arena, these include