Categories
Practice

Sustaining Innovation: Tips for Leading a Maturing Entity

Note: This blog post is for those managers of online learning or extended learning units who are in maturing organizations. If you have started an online learning unit or recently been asked to transition an operation to partially or fully self-supporting and are experiencing growing pains in more than one way, this article was written for you.

In terms of online operations, we are fortunate that we have some very good models from which to model part or all of our organizational structures. We have national quality standards that we can choose to adopt, budding research to point to the successes and challenges in our field, and a strong group of national organizations to help us learn more and remain engaged. Depending on the size of your institution and the scope of your role, some aspects of moving the innovation dial may be easier than others. Yet, as a leader of online learning on your campus, you have the responsibility for applying your knowledge to advance your institution’s mission.

For many years, I have been reflecting on my own successes and deficiencies with leading a maturing online learning department at a selective admissions research university with high research activity. When I was recently asked to transition my Office into a fully self-sustaining unit within two years, my need for reflection intensified.  

Below are a few tips from what I learned through five years of leading a new and now maturing Office of Distance Learning. If I am honest with you and myself, I learned some of these lessons through trial and error or from just making a mistake. Either way, my hope is that these tips and kind suggestions will enable or embolden you in some way on your journey to sustaining innovation.

Acquire Talent.
Your success will depend on how well you can acquire the talent you need. First, you must make your case to the decision makers about why the positions are needed and show your vision for maximizing your human resources. Honor the investments by hiring right. Don’t rush the process. I suggest using a four phase process where you involve your current staff in reviewing applicants, conducting phone interviews with your staff and candidates you are interested learning more about, having the top performers participate in responding to a scenario dealing with a real issue they would face if hired, and inviting your best finalists for a face-to-face interview with a committee.

Be Visible.
Show up. Your visibility on campus is directly linked to your success. Take an active part in opportunities outside of your department and get engaged on issues of University importance that may not be directly related to online learning. This strategy is especially important if you are a self-support unit that depends on departments to provide your courses and programs. Being visible will force you into a new reality of the larger culture and context in which your program belongs. Since that culture and contexts shifts, keeping your finger on the pulse is very important. You also need to tell your story and share your story. Do not assume that faculty, staff, and administrators know and understand the contributions that you make to the larger teaching and learning enterprise.

Eggs in a basketBe Flexible.
My version of flexibility is to have a lot of projects on the drawing board and to offer those ideas to our decision makers. The options allow us to move forward based on the interest of those in charge and prevents me from putting “my eggs in one basket” to use a colloquial term. Moreover, offering options for different ways that projects may evolve is an important strategy when presenting projects to your administrative leaders. Those making decisions want to consider different pathways and to see that you are open to pursuing multiple approaches towards the same end.

Avoid Being Disillusioned.
Accepting that  “control is an illusion” (credit to Wayne Smutz at UCLA) will be the most empowering thing you can do for yourself. None of us are truly in control and remembering will help you to focus your energy on people and relationships. Building relationships and consensus on a path forward has produced the most challenging and rewarding times of my brief career. Accepting that I am not in control, but have influence has helped me avoid wasting energy on the wrong efforts. Remember to not take relationships you have successfully established for granted. I fell into this trap and realized that I had to do a better job of nurturing those original partners in my success. It is easy to get wrapped up in the day-to-day operations and forget how important strategic relationships are, especially when control is not reality.

Engage Faculty in Inclusive Problem Solving.
When we have a problem to solve related to Distance Learning at my institution, my staff and I do our very best to engage faculty. Be it testing an upgrade for our learning management system or discussing policies for student authentication, we ask faculty. Typically, we convene task forces or discussion groups. Set an agenda, moderate the discussion, and let our brightest resources (our faculty minds) problem solve with us. They appreciate being heard and contributing to a better path forward.

Find a Mentor.
I have had the good fortune of having seasoned higher education administrators and faculty members willing to serve as formal and informal mentors to me. Many times, I was being mentored without any awareness that mentoring was occurring. Without their guidance, I no doubt would have made more missteps than I am naturally inclined to make. The point is to find several people who you trust to be honest with you, seek their guidance, and apply what they advise. I am very grateful to those who have mentored me in the past five years of my current journey.

Be a Mentor.
In return for someone mentoring you, you should pay it forward by sharing what you have gained with others, especially your direct reports. The biggest impact you can have on your long-term organization’s growth is to invest your energy and time in those who work for you. I try to create work environment built on investing in my staff’s professional development, showcasing their talents, and pushing each beyond their individual comfort zones. The down side of my approach is the threat of poaching, but I prefer to see someone wanting to hire my staff as a compliment of how well they are being prepared for leadership. So, don’t be afraid to showcase your team’s talents and give them credit. You may end up reporting to them some day.

Timing and Being Told No.
If you want to have sustained success innovating, get used to being told “No!” Unfortunately, I had to learn not to take “No!” as a personal affront because of the time, energy, and effort I had put into a proposal. Over time, I began to understand that “no” really meant, more times than not, that the timing was bad. Asking at the right time or better yet, asking when would be a good time to half finished wall paintingdiscuss X problem is the better solution. I am happy to report that I am experiencing more success when I ask the following. “When would be a good time for us to discuss ….?”

Not Finished.
I am not a finished product, nor is the unit I lead. I have to remind myself often of the strategies that got me here. And if there is one takeaway, it is to put people first. You can never go wrong by putting people first.

Learn More.
If you enjoyed this blog post, then I personally invite you to join me, Susan Aldridge, David Clinefelter, and Cali Morrison for “Developing and Sustaining Strategic Partnerships” at the WCET 2015 Annual Meeting on Thursday, November 12 from 9:45 – 10:45 am in Denver, CO. Come and join in an engaging meeting experience with leaders in many current and emerging aspects in the field of online learning.


headshot of Luke Dowden


Luke Dowden
Director of Distance Learning
University of Lousiana at Lafayette


Note about the author:

Dr. Luke Dowden is the founding Director of Distance Learning at the University of Louisiana at Lafayette. He was the inaugural recipient of the 2014 Online Learning Consortium’s Bruce N. Chaloux Award for Early Career Excellence in Online Education. He serves as the Chair of the WCET Steering Committee, a programmatic advisory group of leaders from WCET’s member institutions. Previously, he led the Louisiana Board of Regents adult learning initiative, Center for Adult Learning in Louisiana (CALL) and served as Dean of Accelerated Learning at Bossier Parish Community College.

Photo Credits:

Eggs in a Basket by Kate Hiscock

Work in Progress by Miquel Wert

Categories
Practice

Recycling, Revitalizing and Reimagining

Today we welcome Stacey Güney, director, HLC ACCelerator, Austin Community College as she shares with us how the rebirth of the physical shell of the Highland Mall has led to the rebirth of hope in ACC students.

Rebirth of the Highland Mall

This past year has been an exciting one for Austin Community College (ACC). On August, 25, 2014, ACC concurrently launched a new campus that overhauled the idea of a college campus, introduced cutting-edge technology, and transformed a core curriculum using adaptive learning.  The Highland Campus is the first phase of the redevelopment of the former Highland Mall.  The Highland Mall opened in 1971 and for many years was the focal point for the entire central Texas region.  Every time I introduce the project, there are always people that want to share their memories of going to the mall over the years.  However, like many malls a variety of environmental issues (internet shopping, suburbanization, the recession, etc.) caused it to fade in recent years.  Everything that made it a great location for a mall makes it a great location for a college.  It sits at the confluence of several major highways.  It is just up the street from The University of Texas at Austin and downtown Austin.  It has great links to public transportation.  The college began purchasing property at Highland Mall in 2010 and acquired the final mall component in 2012. ACC now owns all of the buildings as well as the mall land (more than a million square feet of space and approximately 80.8 acres). The project also involves Redleaf Properties (a private developer) who has options for the areas surrounding the mall that will be redeveloped as a mixed-use community.  From the beginning of the planning, the reincarnation of the mall was envisioned as a center for innovative learning and a place where new ideas and technologies could thrive!  We were space-starved at our older campuses and this new space will allow us to create a state-of-the-art learning environment and center for community and business partnerships and allow us to expand education opportunities for all Central Texans.

Group of students sitting around a table in a study area using Dell Venue 11 Pro 7000 Series (Model 7140 Jefferson) tablets to work on math problems projected onto a large flat screen television, with FluidMath software interface shown.

Revitalizing the Entire Student Experience

While the initial focus of the space was born from the idea of the “math emporium”, it became readily apparent that we wanted to do something even bigger!  This is Texas…we like everything BIG!  MATD 0421 is the first of many courses to be redesigned and to be housed in the space.  Instructors from all areas take advantage of being able to schedule on-demand space for hands-on, collaborative activities using the computer resources to facilitate learning.  Whether it be for an entire course or for unique sessions, the ACCelerator is providing more opportunities for high-touch and high-tech experiences for students outside of the traditional classroom.

In its first year of operation, the ACCelerator has served over 9,500 unique students in over 100,000 visits. In the Spring 2015 semester, the Department of Motion Graphics relocated from another campus and now offers its courses in the ACCelerator and is expanding their footprint.  This fall, we are welcoming several new programs into the ACCelerator.  The computer-aided design (CAD) department will be offering courses. A competency-based Accelerated Computer Training program will be offered as part of both a new Career Expressway program and our Early College High Schools. Math is continuing to spread increase its enrollment.  We are extending our hours to midnight Monday-Thursday.  Besides content-specific instruction through scheduled courses, the ACCelerator also offers tutoring, supplemental instruction, open computer lab access, and academic coaching.  It is also home to the AARP Back to Work 50+ at ACC grant.

Reestablishing a Community

In the same way that the space functioned when it was a mall—as a gathering place—it is now serving the same role for the community in its reincarnation. Students have embraced the space and are developing a community of practice around learning how to learn. Several groups have “cohortized” themselves into study groups. While we do not offer nursing courses at this location, it is centrally located and a group of nursing students meet every afternoon after their clinical, even serving as ambassadors of the program for prospective students. We have a group of students who are meeting every Friday and Saturday morning for Maker Meetups using Arduinos and Raspberry Pis in order to create projects that span across numerous curriculum areas.  (My favorite project is the music student who also DJs at a local club and programmed sensors into a pair of gloves, thereby allowing her access to numerous controls without physically moving her hands around!)

In addition to students supporting one-another, we have five part-time “academic coaches” who are available for scheduled and drop-in meetings. They work with students who feel they “just don’t get it.” They are struggling not with a particular subject matter, but with what it means and what it takes to be a college student. The coaches work through a range of non-cognitive skills such as time management, organization, note-taking, test-taking and study skills.  Over 400 students have seen academic coaches for support in these techniques and skills. This fall, we will be expanding the use of the coaches and partnering with faculty to introduce “nudges” to boost student engagement.

Reengaging with Learning

Students are engaging with their learning in new ways. As a result, they come to the ACCelerator, they stay, and they return.  Anytime we have the opportunity at a commuter college to engage with our students in these deep and meaningful ways, we know that it directly contributes to student success. Students are coming to the ACCelerator even when there are no scheduled classes on campus. They are coming before their classes and staying on after their classes. Students that don’t even have classes at this campus, use the space as a study resource.

Older male college professor holding a Dell Venue 11 Pro 5000 Series (Model 5130 Midland) tablet computer and showing it to a young female college student, standing in the hallway of a campus building.

The space also means that there is “no back of the classroom”—the typical place where at-risk students tend to try and hide. The technology also used in the curriculum doesn’t allow for students to hide. Each professor knows exactly where each student is and this helps to create a much more personal connection with students. The withdrawal rate is significantly lower and the retention rate significantly higher in the developmental math compared to the traditional courses.

Other courses taught in the ACCelerator express that the environment is much more like the professional environment that the students are already in or will be in their professional lives. Courses that are scheduled in the space on an “ad-hoc” basis enjoy the benefit of having a flexible space that they can use for more collaborative and project-based learning.

Reviving Students Dreams

One of my favorite things is to be at the “Start Here” desk on the first day of a new semester and see the students arrive into the ACCelerator for the first time.  You can tell it is their first time in the space by the look on their face when they walk in.  First, they are first impressed by the sheer expanse of it all.  Then, they realize that this is something different.  It isn’t a traditional classroom where the focus is on many things but not necessarily on them.  They can see in the way that we all interact that they are the focus of this new environment.  I am reminded of one of my students, Rafina, who is an assistant in a nursing home. Last semester, she pulled me aside with tears in her eyes and thanked us for giving her hope back.  “I’m 52 years old and I had given up on my dreams of becoming a nurse.  But I can do math now in this program.  You have given me my hope back.”  This new environment isn’t just transforming their educational experience – it is giving them their hope back. Giving students hope that they can achieve their dreams through education is the reason that I am in the world of higher education in a community college.


Key Takeaways

  • Launching a huge and complex hybrid initiative like the ACCelerator requires buy-in, support and investment from institutional leadership.
  • A strong face-to-face support system is a crucial element alongside this technology-rich environment
  • Student are embracing the new incarnation of the mall and the opportunity to create a learning community.
  • The space continues to evolve in new and dynamic ways in order to support student needs and improve student access and engagement.


headshot of Stacey GuneyStacey Güney

Director – HLC ACCelerator, Austin Community College

austincc.edu/highland-campus/accelerator


Like, follow, and tweet with us:

twitter.com/ACC_ACCelerator

facebook.com/acceleratoracc

pinterest.com/acceleratorcoac

instagram.com/acc_accelerator/


Links to additional resources:


Categories
Practice

Connected Devices, Connected Colleagues

You will not want to miss the WCET Annual Meeting in Denver at the beautiful Westin Downtown,  November 11-13.  Though the fall meeting schedule is packed,  a recent attendee said, “WCET is the one meeting on my agenda that I WILL NOT miss.” The following are a few reasons the WCET Annual Meeting provides such significant return on your professional development investment,  whether you are a WCET member or non-member.

Tabor Center Denver ColoradoWith over 50 concurrent sessions and over 100 speakers, the 27th WCET Annual Meeting is an outstanding lineup of forward thinking innovators, practitioners, and thought leaders in higher education technology. We have pulled together people from across the U.S. and Canada to share their good practices and lessons learned regarding technology-enhanced teaching and learning.  In typical WCET fashion, nearly every session includes multiple perspectives to provide diversity of experience, institution type, and student populations.   Additional sessions, workshops, and speakers will be added over the next several weeks.

The topics included in the program cover key issues you and your institution need to be aware of — some may be on your radar while others are further on the horizon:

  • Adaptive learning.
  • The Internet of Things.
  • Federal policy and the impact on students, institutions, states, and accreditors.
  • Working with vendors.
  • Why and how to make accessibility a priority.
  • Managing CBE- from starting an initiative to developing a transcript.
  • Leading in an era of innovation.
  • Managing and inspiring adjuncts.

Additionally, the Annual Meeting program is a blend of panel presentations and unique session formats including loosely organized discussions around a key issue, flipped sessions where attendees view  a short video prior to the session and use the time for discussion, and extended in-depth sessions which  include panel discussions, audience interaction, and action oriented outcomes around emerging issues.

When you walk the halls of the WCET Meeting you will notice one thing is missing compared to other conferences- there is no exhibit hall.  We do not have a typical exhibit hall where vendors sit waiting for attendees to engage with them.  WCET finds it more valuable to connect institutional attendees and corporate attendees organically around the topics that matter to all of our work.  For the first time, we will be offering a tech expo where 10-12 companies are invited to showcase their edtech products/services.  They will each have about 10 minutes to present and then attendees will have an opportunity to visit with the corporate partners they are interested in connecting with. We want to hear from you, what companies would you like an opportunity to talk with? Email wcetconferenceATwiche.edu or leave a comment below.

attendees from 2011 WCETAnnual MeetingWhether this is your 27th Annual Meeting or you will be a first time attendee, you will feel part of an inclusive community.  The meeting is capped at 450 attendees so you will see familiar faces and build your network.  The event includes several valuable opportunities for connecting with people.  On Wednesday afternoon, learn more about WCET and see what we are planning for 2016 during the Reflecting and Looking Forward: WCET 2015-2016 general session.  First time attendees will have an opportunity to connect with a friendly mentor who will help you navigate the program and the event.  A welcome reception will follow, which is a fun social event to reconnect and meet new friends.  Wednesday evening also includes our popular Group Networking Dinners where you sign up in advance for a dinner group to join at a nearby restaurant.  For the first time, you can combine your Friday morning workout with networking with new friends during Reenergize with WCET — which will include yoga and/or an organized walk/jog/run. Those are just a few of fun networking opportunities available.

I invite you to view the preliminary program and hope to see you in Denver!  When we were in Denver in 2013 we did sell out by October, so you do not miss out, register soon.

Cheers from the mile high city,

Megan Raymond HeadshotMegan Raymond

Manager, Events and Programs

WCET

Categories
Uncategorized

Ensuring Quality in Alternative Higher Education: Quality Matters’ Perspectives

Today we learn with Deb Adair, Managing Director and Chief Planning Officer, Quality Matters and Julie Porosky Hamlin, Executive Director, MarylandOnline; Member, Quality Matters Board of Directors their perspective on quality assurance for alternative higher education.  Thank you Deb and Julie for lending your many years of experience in assuring the quality online education to the continuing discussion of alternative higher education.

In the fall of 2013, the Presidents’ Forum (operating out of Excelsior College) and the Council for Higher Education Accreditation (CHEA) created a Commission on Quality Assurance and Alternative Higher Education.  They invited 26 individuals to discuss, over a three-month period, the idea of a quality review for the growing number of non-institutional providers of (largely online) courses.  In August of 2014, they published a paper, Quality Assurance and Alternative Higher Education: A Policy Perspective.

The group identified six questions for further inquiry.   Quality Matters (QM) did not participate in the discussion and we would like to contribute perspectives from our 10+ years in the field of quality assurance for online education.  Up to now, the QM rubrics and peer review process for certification of online quality have focused on the course level, but a program-level certification will be launched this year.

It’s a priority for us to be sure QM meets the needs of alternative providers; fits our tools and processes to their teaching and learning formats; and includes the voices of their representatives in our QA—quality assurance—community.

We’ve organized our thoughts around the six questions.

Would a Review of Alternative Providers Provide a Viable Public Service?

Q: Would a quality review process for alternative providers of postsecondary education offer effective documentation of quality and credibility to the public, including students, policy makers, and employers, providing a useful and viable public service?

A: Effective documentation must be a goal, perhaps the most important goal, of a quality review process that would serve the needs of alternative providers and provide QA for the consumers of their educational products.  Consider how useful it would be if we had a set of format-agnostic quality benchmarks that enable all stakeholders to compare courses offered by non-institutional providers with those offered by academic institutions. For that matter, comparisons within these sectors would be enabled as well. Using comparative data, students would be able to make informed choices, and policy makers would be provided with a common understanding of what constitutes a threshold of quality.

A common definition of online course quality would also enhance the transcript review process used now by academic institutions to accept and assign credit for courses from other providers.  It would offer academic institutions an efficient way to move beyond a review of course content and instructor credentials and to include other factors known to be important to student success.

We at QM have seen the benefits of creating such a threshold for quality and a process for benchmarking across institutions. Very often, the QM course review process and certification have been instrumental in intra-institutional direction setting and collaboration across units.

Many inter-institutional academic collaborations also rely on the QM standards and course reviews to support course-sharing initiatives.  In fact, the fastest-growing segment of QM subscribers are those participating as systems of institutions.  Currently, more than 60% of all subscribers do so as part of a consortium or system of institutions. We expect that the large number of QM subscribers who have invested significant time and effort to ensure the quality of their own courses will advocate for similar standards to be required of “credit-intended” courses offered by competing non-traditional providers.

What About a Cost-Benefit Analysis of a Quality Review Process?

Q: Would a preliminary cost-benefit analysis of a model quality review be informative? If so, how might this be done?

A: Once agreement is reached on the factors to be included in such a review, we can compare different review models already in existence to better understand the tradeoffs to be considered in understanding costs and benefits.  There is the traditional model of higher education accreditation, with significant expense in both time and money for on-site review.  The affordances offered by online education, the format utilized by a majority of alternative education providers, support a more cost-effective process of online, rather than on-site, review.  We offer Quality Matters’ approach as one model used to ensure the quality of online course (and soon program) design.

A QM higher education Peer Review team is composed of three trained and certified online instructors, at least one of whom is a subject matter expert and at least one of whom is external to the institution hosting the review.  The team, chaired by a Master Reviewer who has additional training and experience, is charged with taking the student perspective, applying the 43 QM standards with guidance from the annotations for each, and writing recommendations for improvement.

Recruiting, screening, and training the “talent” for conducting quality reviews is a challenge in itself.  QM has had more than a decade to figure it out, and we’re still fine-tuning and continuously seeking improvements.  Our online database contains more than 4,000 Peer Reviewers and Master Reviewers from across the country, and now internationally. A review typically takes three to six weeks for the first assessment and report; however, faculty/course developers have a total of 20 weeks to get through the review, including, if needed, time to make the recommended course improvements.  QM can and does manage these reviews for a fee; however, institutions may self-manage these reviews with proper training and certified reviewers.

As a result of a QM review, which is open and collegial, the faculty/course developer receives a report with improvement recommendations as well as certification of the course.  Using the Rubric and experience from benchmarking reviews, many institutions are now routinely training faculty and designing their online courses to fit the standards, an approach that prepares the courses for a successful review.  In these ways, institutions have been able to manage the time and dollar expense of course-level quality assurance.

Are You Planning to Pilot the Proposed Quality Review Process?

Q: Would development of an experimental model provide a means to demonstrate and test a workable quality review process? What might that model look like?

As obvious as it may sound, an effective quality review process must be anchored by assumptions about what constitute quality and those assumptions must be codified or captured in what we most often call “standards.”  Perhaps somewhat less obvious is that the standards themselves must have a clearcut focus or target to support consistent application.

The QM Standards, as an example, are focused on supporting student success.  QM has identified factors that are “important,” “very important,” and “essential” to student success.  The QM certification mark is intended to ensure:

  • a course is coherent and aligned with the course and module learning objectives:
  • that the purpose of the course, course components, and their relationships is made clear to students;
  • that the course is easy to use–in navigation, technology, and setting and communicating expectations– ensuring intra-course mechanics and extra-course requirements are not a barrier to learning;
  • that the course is built to engage learners and promote active learning;
  • that the content and assessment support the appropriate levels of learning;
  • that the learner is guided to technological, academic, and student support; and
  • that the course is accessible to all learners.

How did we come up with this particular set of standards?  Our flagship Rubric for Higher Education is now in its fifth edition, a clue that the standards have evolved.  Through a widely participative and in some ways messy process, QM standards are developed and regularly updated from a ongoing review of the research literature on student learning (see QM Research Library); from evidence-based practices; from analyses of review outcomes for the last 10 years; and from a large and growing community of practitioners actively engaged in using the standards.

QM’s mantra is continuous improvement, and our review process aligns with the quality assurances practices adopted in industry and other sectors with which education interacts. QM’s core elements are clear standards of quality for course and program design, training on the standards for faculty serving as course reviewers, and a review process focused on continuous improvement.

QM’s emphasis on continuous improvement is suggested in Figure 1, a back-of-napkin graphic that dates to QM’s earliest days as a grant project funded by the U.S. Department of Education.

Figure 1: QM Course Review Process

QM peer review process

What About Competencies and Student Outcomes?

Q: Inasmuch as the offerings of many alternative providers are designed to enable the student to master or demonstrate specific knowledge or skills, would a quality focus that measured competence (student outcomes) be a productive approach?

A: The ability to determine quality in a competency-based approach to education is as important for traditional academic institutions developing competency models as it is for alternative providers.

QM has been actively following the activities and research surrounding the competency-based education (CBE) movement. Our initial response is demonstrated in the Fifth Edition of the QM Higher Education Rubric, which includes guidance for evaluating competency-based learning. Much more work is needed to understand and guide approaches to CBE quality. QM looks forward to participating in the QA effort through collaborative initiatives to survey the field of CBE and identify the issues that need to be addressed through policy and practice.

Would It Lead to Alternative Providers Qualifying for Federal Student Financial Aid?

Q: Would an external quality review process for alternative providers offer a potential pathway for these organizations to qualify to participate in federal student financial aid programs, if such an opportunity were available?

A: Postsecondary education now includes more teaching-learning formats (MOOCs, CBE, adaptive learning, gamification) than it did just a few years ago, formats that are being embraced and experimented with by even the most traditional institutions, and credentials themselves are undergoing a rapid evolution.  External quality review, with its assurance of objectivity, could be an important component in a trend already begun.  The recent granting of financial aid for students earning degrees in CBE programs at collegiate institutions suggests the federal government in the near future may consider supporting other alternative formats from alternative providers.

How Would QM’s Work Lead to Greater Acceptance by Traditional Higher Ed?

Q: How would greater cooperation or adoption of some form of third-party verification or certification of standards of practice shared among organizations that review courses or student learning for credit improve wider understanding, acceptance, and utilization of the work of these organizations by colleges and universities?

A: This question asks, in part, how to broker a deal between external organizations that have developed principles addressing educational quality (QM, ACE, OLC are examples) and the colleges and universities that must be convinced these principles and the processes for applying them are sound: sound enough to warrant entering into a college transcript a “course” or other package of learning from an alternative provider. For quality assurance of alternative education to be effective, all parties must agree on standards and buy in to an evaluation process.

QM was developed as an answer to the need for inter-institutional quality assurance in online learning for a consortium of higher education institutions. Participating institutions had worked out how to run a seat-sharing program to allow students to enroll in one another’s courses, but the problem remained to convince stakeholders that students would be receiving an equivalent quality learning experience regardless of where they took their course. A common metric, one that is valid, consistently and rigorously applied, and collaboratively developed, was the answer that worked for the consortium, and later for other consortia around the country.

In Conclusion

We at QM are excited about the new educational options brought by alternative providers and excited to participate in a broadened and inclusive conversation about quality.


Deb Adair headshotDeb Adair,
Managing Director and Chief Planning Officer,
Quality Matters


Julie-Porosky-HamlinJulie Porosky Hamlin,
Executive Director, MarylandOnline
Member, Quality Matters Board of Directors


Categories
Uncategorized

Defining a New Model of Education: What Do Coding Bootcamps Mean for Higher Ed?

David Clinefelter, Chief Academic Officer at the Learning House,  joins us on the Frontiers blog today to share a partnership that is bringing college credit to coding bootcamps, helping students gain real world skills and credit towards a college credential at the same time. Thanks, David!

Innovation is the name of the game in higher education recently, and the federal government is getting in on the act. The Obama administration has made improving access to education, increasing the number of high school and college graduates, and promoting skills for a 21st century workforce a priority. While not the only factor, this commitment has helped to drive the growth of a new form of learning called coding bootcamps. Taking their nomenclature from the intensive training new recruits into the armed forces go through, coding bootcamps are intended to provide short term (eight to 14 weeks), immersive (all day, every day) programs that train people to be software developers (coders).

A National Commitment to Change

Coding bootcamp in actionIn early March, President Obama announced his Tech Hire initiative, which aims to help people acquire the practical skills they need for employment in “well-paying” technology jobs, such as software developers and coders. The initiative is encouraging both traditional colleges and universities as well as non-traditional providers to consider how they can better serve their population by enabling them to acquire relevant job skills for an evolving economy.

According to the White House, there are 500,000 open tech jobs, and not enough workers to fill this demand. These jobs are not concentrated only in tech hubs like San Francisco, but rather, are in cities across the country. Every city and region needs more coders.  To help meet this need, the Tech Hire initiative is trying to bring together public and private investment dollars, as well as encourage new, faster models of skill acquisition, such as coding bootcamps.

As part of the Tech Hire initiative, the federal government is investing $100 million to train and connect workers to good jobs in technology and related fields. Private companies, such as LinkedIn and Capitol One, are committing to aid the program.

Of those non-traditional models of education, coding bootcamps appear to be one of the most promising.

Technology Goes Local

code Louisville logoNot only is there a national commitment to increasing tech skills, but also local initiatives as well. Code Louisville, for example, is a coalition of government agencies and private enterprise developed to train people in Louisville, Kentucky, for the jobs of tomorrow.

“It’s kind of this vicious cycle,” said Rider Rodriguez, one of the co-founders of Code Louisville, in an interview with WFPL. “We don’t have a lot of software developers here because we don’t have a lot of software developers growing up. You don’t run into a lot of people who have those skills and do those jobs.”

Defining A New Model of Vocational Education

The appeal of bootcamps is simple: in some short, defined period of time (typically eight to 14 weeks), students will gain relevant skills that will enable them to find a well-paying job. Although currently bootcamps are focused on teaching programming languages, it is possible that in the future, they will be offered in disciplines such as marketing or finance.

Many bootcamps boast exceptional job placement rates for graduates; the Software Craftsmanship Guild (SWCG), for example, has a 96 percent placement rate.

“Bootcamps offer a unique opportunity to serve a distinct population,” said Eric Wise, founder and Chief Academic Officer of the Software Craftsmanship Guild. “Because they are so short, intensive, and skills-based, they appeal to highly motivated, talented people who don’t want or need to commit to a four-year degree, but who do want to make a change in their career and their life.”

How Do Bootcamps Work?: A Case Study

Learning House, a provider of online education solutions, was intrigued by the potential of coding bootcamps, but also realized the academic potential this model had. When Learning House began to consider offering bootcamps, most of the providers in the space were small, for-profit companies that were focused primarily on job placement as an outcome. Learning House imagined more.

“Bootcamps provide a terrific introduction to coding, giving students a solid foundation in core principles of software development,” said Dr. David Clinefelter, Chief Academic Officer of Learning House. “But we also know the value of the four-year degree. We felt that by partnering with an accredited, not-for-profit institution, we could expand the potential of bootcamps.”

Learning House turned to one of its partner institutions, Concordia University, St. Paul, for help in launching this innovative program. Using curriculum and expertise developed by SWCG, Learning House and Concordia were able to develop a coding bootcamp in the St. Paul area. Not only did the course teach the fundamentals of .NET to students, but it also offered college credit to students who graduated from the program.  The credits count toward the University’s BS in Computer Science, and students are eligible for financial aid if they commit to continuing in the computer science degree program after completing the bootcamp.

“Working with Learning House and the Software Craftsmanship Guild allowed us to offer students in Minnesota an immersive experience that prepares them not only for the jobs of today, but also for the industries of tomorrow,” said Eric LaMott, Senior Vice President and Chief Operating Officer at Concordia University, St. Paul. “The development of this program supports our goal of being responsive to the needs of today’s students and relevant to the skills employers seek.”

Getting Started

Developing a bootcamp program is, in some ways, both easier and more difficult than launching a new traditional program.

“We were able to rely on the experience SWCG brought to the table, which was an immense help,” said Todd Zipper, President and Chief Executive Officer of Learning House. “But there were a lot of operational logistics that also needed to be figured out, and figured out quickly.”

Concordia University provided the classroom for the coding bootcamp, administrative services such as financial aid, and most importantly, academic oversight.  The Learning House provided marketing, enrollment management, and recruited companies for an employer network.

Once the physical space was identified and set up, students were needed. The appeal of bootcamps, however, was evident from the marketing campaign. With minimal marketing – a mention on a local morning television show, some radio advertisements, and word of mouth – the inaugural bootcamp class was quickly filled.

“Students want a program that they know will lead to a positive result,” said Zipper. “Our Coding Bootcamp so clearly offered relevant, real-world skills, leading towards jobs with high salaries. And because we were partnered with a college that students recognized, they knew they could trust the quality of the education they were receiving. It was a win-win.”

Bootcamp Operation

CSP coding bootcamp logoThe Coding Bootcamp at Concordia is a 12-week, full-time, immersive program. From 9 a.m. to 4 p.m., students attend class in person and, through a mixture of lectures and practice, learn the fundamentals of either .NET or Java software languages.  The students are also expected to put in an additional 20 to 30 hours of work outside of the classroom per week.

Learning House has partnered with approximately a dozen local employers to help graduates find software development jobs. That employer network continues to grow, as demand from employers and IT recruiters increases.

For those students who wish to pursue their education, they are admitted into Concordia’s BS in Computer Science program, and will be given 12 college credits for completion of the bootcamp.

The Results

Even though the University and the Learning House were confident there was a need, the rapid success of the program still came as a surprise. Each session of coding bootcamp at Concordia has space for 12 to 16 students; before the first session launched, there was already a waiting list for the next session.

Such interest was not misplaced. Although the bootcamp demands a lot of time and energy, there was a 100% retention rate for the inaugural class.

“We asked a lot of our students,” said LaMott. “But we also worked to make sure everyone we admitted had the drive to succeed, and knew the expectations of both time and effort the bootcamp would require.”

Coding bootcamp gradsBefore admission into the bootcamp, students are required to complete an aptitude test and conduct an interview with an admissions counselor. They also completed approximately 60 hours of prework (online tutorials about coding basics.)  This helped ensure that all who were admitted had enough interest and ability in coding to stick with the intensive program. These admissions requirements not only helped the retention rates of the program, but also helped ensure a better classroom experience, since almost all students had the same level of expertise and passion for the subject.

Job placement rates are calculated after 90 days, so the final numbers are not in yet for the first bootcamp class. But within the first two weeks after completing the bootcamp, almost 70 percent of students have jobs as software developers. Several have chosen to continue into the BS in Computer Science program at Concordia.

The next bootcamp session also is filled, and the same retention and job placement rates are expected.

What the Future Holds

The success of the Concordia coding bootcamp confirmed Learning House’s commitment to bootcamps as a model of education for the future.  To that end, Learning House acquired SWCG and intends to offer coding bootcamps across the country. By the end of 2015, Learning House will be offering bootcamps in Akron, Ohio; Louisville, Kentucky; and St. Paul, Minneapolis. Learning House partnered with Code Louisville to help launch its Louisville bootcamp.

“Bootcamps are an extension of the core philosophy of Learning House that education should empower you to live the life you want. We could not be more pleased to be bringing the expertise of SWCG into the Learning House family, and we look forward to being on the forefront of this new education model.”

As more bootcamps are offered and more employers experience the value graduates can bring to needed, and hard to fill, roles, Learning House anticipates even more partnerships with major employers and universities in cities where bootcamps are offered. This new model of education – one where education and industry work together to provide students with relevant skills that prepare them to become drivers of the economy – offers immense possibility. Learning how to successfully become a part of this new approach to education will be critical to the success of institutions in the coming decades.


Dave Clinefelter headshotDavid Clinefelter
Chief Academic Officer
The Learning House

Categories
Practice

Breaking Bad: Improving College and University Teaching

Tony Bates has had a distinguished career promoting distance learning and open learning and content initiatives around the world.  Today Tony shares with us his latest book – an online, open textbook – as a resource for those teaching in our current digital age.  Thanks, Tony!

or: why I wrote an open online textbook for faculty.

I’ve just published an online, open textbook, Teaching in a Digital Age, aimed at faculty, instructors and teachers. As the title suggests, it’s a guide to teaching in an age when our students are immersed in technology. My aim is to give teachers, instructors  and faculty a foundational base of  theory and knowledge for their teaching, no matter what changes or pressures they face.

Why this book?

The main reason I wrote the book is because I couldn’t find anything similar for college and university faculty that provides in one place all that they need to know to teach well in today’s challenging environment. In particular, I wanted to provide some guidance on the following issues faced by all instructors today:

  • is the nature of knowledge changing, and how do different views on the nature of knowledge result in different approaches to teaching?
  • what is the science and research that can best help me in my teaching?
  • how do I decide whether my courses should be face-to-face, blended or fully online?
  • what methods of teaching are most effective for blended and online classes?
  • how do I make choices among all the available media, whether text, audio, video, computer, or social media, in order to benefit my students and my subject?
  • how do I maintain high quality in my teaching in a rapidly changing learning environment while managing my workload?
  • what are the real possibilities for teaching and learning using MOOCs, open educational resources and open textbooks?

What’s in the book?

Teaching in a Digital Age Image
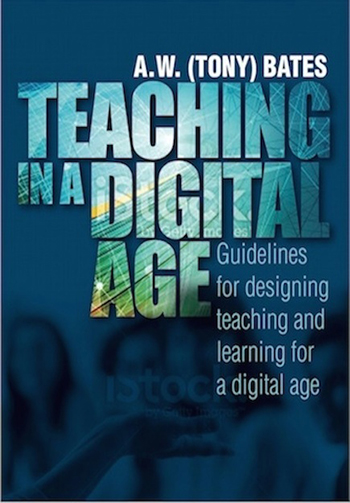
There are really six parts to the book.

The first chapter sets the stage for the rest of the book. It looks at the key changes that are forcing teachers and instructors to reconsider their goals and methods of teaching. In particular it identifies the key knowledge and skills that students need in a digital age.

Chapters 2 through 5 on epistemology and teaching methods address the more theoretical and methodological aspects of teaching and learning in a digital age. Chapter 2 covers different views on the nature of knowledge and how these understandings of knowledge influence theories of learning and methods of teaching. Chapters 3 and 4 analyze the strengths and weaknesses of different methods of teaching ranging from solely campus-based through blended to fully online. Chapter 5 looks at the strengths and weaknesses of MOOCs. These chapters form a theoretical foundation for what follows.

The focus of Chapters 6 through 8 is on how to choose and use different media and technologies in teaching, with a particular focus on the unique pedagogical characteristics of different media. Chapter 8 ends with a set of criteria and a model for making decisions about different media and technologies for teaching.

Chapter 9 addresses the question of how to determine what mode of delivery should be used: campus-based, blended or fully online. Chapter 10 examines the potentially disruptive implications of recent developments in open content, open publishing, open data and open research. This chapter above all is a messenger of the radical changes to come to education.

Chapter 11 and Appendix 1 take two different but complementary approaches to the issue of ensuring high quality teaching in a digital age. Chapter 11 suggests nine pragmatic steps for designing and delivering quality teaching in a highly digital teaching context. Appendix 1 looks at all the necessary components of a high quality learning environment.

The last chapter very briefly examines the policy and operational support needed from schools, colleges and universities to ensure relevant and high quality teaching in a digital age.

There are also ten ‘what if’ scenarios scattered throughout the book. The purpose of the scenarios is to stimulate imagination and thinking about both our current ‘blocks’ or barriers to change, and the real and exciting possibilities of teaching in the future.

Why a free, open textbook?

Many faculty are fiercely independent and many, indeed a majority, never go to formal faculty development sessions, so I wanted something really accessible, available at a click: no credit card payments, no workshop enrolment, just a resource available at any time, as and when instructors need it.

The book in fact can be used in many different ways:

  • as a resource for individual instructors
  • as a resource/prior reading for faculty development workshops
  • as a foundational reading for formal courses as part of a graduate program aimed at teachers and instructors
  • parts or sections can be used as resources for those wanting to take a different approach to faculty development.

It can be easily and continually updated, and indeed I’m hoping to build communities of practice around the book so that it remains current over time.

Lastly, I’m at the end of my career. I’ve already published eleven other books through commercial publishers, and I’ve had a wonderful career in educational technology over the last 40 years, so this is somewhat of a legacy project, pulling together all my experience into one place, and making it easily available to anyone who’s interested.

My main goal though is to make college and university teaching more effective, and move it from a broken, amateurish model to a more professional one. So please spread the word, and I hope you will find the book useful, too.

Tony Bates headshotDr. Tony Bates
President and CEO,
Tony Bates Associates Ltd

Categories
Practice

Opening the Doors to Education: Ensuring Accessibility in Open Textbooks

Accessibility is a concern across all of technology-enhanced education.  At BCcampus, they wanted to help content creators incorporate accessible practices into their open materials. Amanda Coolidge, Open Education manager at BCcampus, shares with us how they crafted the BC Open Textbook Accessibility Toolkit and how you can take advantage of this great resource.

The BC Open Textbook Accessibility Toolkit is a collaboration between BCcampus and the Centre for Accessible Post-secondary Education Resources BC (CAPER-BC). BCcampus is a publicly funded organization that uses information technology to connect the expertise, programs, and resources of all B.C. post-secondary institutions under a collaborative service delivery framework. BCcampus is the lead organization for the BC Open Textbook project. CAPER-BC provides accessible learning and teaching materials to students and instructors who cannot use conventional print because of disabilities.

BC Campus Open Textbook Accessibility ToolkitAt the end of 2014, BCcampus and (CAPER-BC) contacted the Disability Services Coordinators at partner institutions to find student participants with print disabilities to evaluate British Columbia (B.C.) open textbooks. The participants were asked to evaluate five chapters from the open textbook library and provide their evaluation on each chapter. They were asked to access the materials in their preferred layout, such as web format, ePub, or PDF, and then provide written feedback about their experience. This model worked well, but we decided to take this further and invited the participants to join us for a half-day focus group, where we had the opportunity to understand why they responded to the questions – or didn’t respond – to see how they were reading and accessing the materials on their different devices. Based on student feedback, we were able to create a series of tasks to make our own textbooks more accessible.

Working with Tara Robertson from CAPER-BC, and Sue Doner, an instructional designer from Camosun College who has been working with universal design and creating accessibility guides for instructors, we have developed an accessibility toolkit.  The goal of the BC Open Textbook Accessibility Toolkit is to provide the needed resources needed to each content creator, instructional designer, educational technologist, librarian, administrator, and teaching assistant to create a truly open and accessible textbook — one that is free and accessible for all students.

We developed the toolkit in Pressbooks, and as a result it is available in a variety of downloadable formats (PDF, EPUB, MOBI, XHTML, and WordPress XML). Within the toolkit you will find information on how to make content accessible, with specifics on:

  • Images/Charts/Graphs/Maps
  • Weblinks
  • Tables
  • Multimedia
  • Formulas (math and scientific)
  • Font size
  • Colour contrast

BC Open Textbook Accessibility Toolkit Team workingAs you work through the content of the BC Open Textbook Accessibility Toolkit, you will find that the suggestions provided are intended for the non-technical user. If you are looking for more technical descriptions of how to make your work accessible, we suggest you review the WCAG (Web Content Accessibility Guidelines).

Based on some of the accessibility testing we conducted, our technical team at BCcampus is creating a new accessibility plug in for Pressbooks. The plug-in will give users the option to modify the user interface and the exports’ interface, font size, and line spacing for accessibility purposes.

If you have comments, suggestions, or questions about the BC Open Textbook Accessibility Toolkit we would love to hear from you. Please contact us at opentext@bccampus.ca
Photo of Amanda CoolidgeAmanda Coolidge

Manager, Open Education

BCcampus 

Twitter: @acoolidge

Categories
Practice

eCampusAlberta Quality Rubric for Online Courses

A long time supporter of WCET, we are delighted to hear from Tricia Donovan, executive Director of eCampusAblerta today.  Thank you, Tricia, for sharing with us eCA’s work in developing the quality eToolkit. 

eCampus Alberta LogoeCampusAlberta is a consortium of 26 publicly funded post-secondary institutions in Alberta.

From its inception, the consortium was established to increase access to high quality online learning offerings across the province of Alberta. Set in a backdrop of strong institutional autonomy, the advent of a senior executive-led initiative required unprecedented institutional collaboration. Participating institutions sought ways to inform their efforts to collaborate, and the development of eCA Quality Standards became a mechanism to facilitate trust and inspire shared practices across member institutions.

Creating the Original ‘Quality Suite’

Work on quality began shortly after the consortium was formed. In 2005, members developed a position paper on Quality Standards which was primarily adapted from the widely heralded Quality on the Line: Benchmarks for Success in Internet-Based Distance Education, published by The Institute for Higher Education Policy and Blackboard, May 2000.

The Quality Standards were used as a requirement for access to funding for online curricula and eventually became adopted or adapted for design at many of the member institutions. In 2007, further development of the standards resulted in a suite of resources to support the development of online curricula through what was known as the eCampusAlberta Quality Suite. The suite included a set of  Essential Quality Standards, a Quality eRubric, a Curricula Assessment Scorecard and a Course Review and Report Process.

In 2012, It Was Time to Refurbish our ‘Quality Suite’ or Move On

In 2012, eCampusAlberta evaluated the eCA Quality Suite in terms of effectiveness, usage, and alignment with current academic literature on quality of online courses. Emphasis was placed on determining if revisions of our Quality Suite were needed or if we would benefit from adopting an existing external set of quality standards.

An intensive review of more than 40 online course quality standards was conducted, as well as a literature review of quality standards, quality assurance principles, processes in higher education and online learning in many jurisdictions. We also surveyed our eCA Quality Suite users and eCA course reviewers and consulted with experts in online course development.

We found that there was a strong correlation between other established quality standards and the eCampusAlberta Quality Suite and high levels of awareness/usage of and satisfaction with the Quality Suite. And we also identified areas in which additions and improvements were needed.

We determined that our standards were robust and held up well against others in the field and we worked on process revisions and updates to support the use and application of the standards.

The links below provide access to our Quality Suite of materials, all of which is licensed under Creative Commons and we encourage WCET members to use our work. The OERu has adopted our Quality Standards globally and they are currently being reviewed for applicability with open educational resources.

eCampusAlberta Quality 2.0

In July 2014, we launched the eCampusAlberta Quality Suite 2.0.  The suite is comprised of the Essential Quality Standards, the eLearning Rubric, the Quality eToolkit, an online review and database system, and many quality-related professional development resources and opportunities. We also introduced three levels of achievement on the quality standards – expanding beyond those standards deemed Essential to include those identified as Excellent and Exemplary. This initiative was viewed as a means of recognizing the work of those faculty, designers and institutions that were exceeding the minimum or essential standards to more robust design standards. It is interesting to note that where we had experienced challenges in meeting the Essential Standards across the consortium for year, many institutions are inspired to showcase their work in all three levels of the standards.

Essential Quality Standards and Course Review Process

The Essential Quality Standards include a new rubric approach which offers criteria for Essential (the required level for courses to meet), Excellent, and Exemplary levels for each standard. It also includes examples of effective practice and academic references. These are licensed under a Creative Commons Creative Commons Attribution 3.0 License.

The Course Review Process guides the provision of review services to members. eCampusAlberta reviewers use the new online course review system to evaluate member courses prior to these being added to the eCA Course Catalogue for delivery. Review reports are provided to the institutions. The review process defines expectations of timelines and deliverables for all participants. As reviews are conducted, the Quality Team identifies examples of quality course design that institutions are asked to share as examples of effective practice. Some institutions have decided to create templates based on the Essential Quality Standards for their online courses, and these are reviewed upon request.

Quality eLearning Rubric

The eCampusAlberta eLearning Rubric supports the creation of quality online curriculum. Developers may use the free online rubric to self-assess their courses using the Essential Quality Standards. Their reviews can be saved and reports can be downloaded. All works are licensed under a Creative Commons Attribution 3.0 License.

ECA Quality Toolkit buttonsQuality eToolkit

The Quality eToolkit hosts all of our quality resources and supports our quality services. Components include the Essential Quality Standards and their accompanying resources, the online Quality eLearning Rubric, Frequently Asked Questions, background information, information on the Course Review Process, an annually updated literature review, examples of effective course design provided by member institutions, and more.

Quality Professional Development

Quality-related professional development is an ongoing activity that includes webinars, orientation sessions, articles, conference sessions, workshops, etc. The Quality Manager provides consultation with institutions as requested and customized sessions are also delivered as needed. Reviewer training is also ongoing. Webinars are also available at no cost to participating institutions and a new “Quality Corner” has been recently added to our eZine to promote dialogue and awareness of quality standards and approaches.

After one year of implementing, and hearing mixed reviews anecdotally, we initiated an evaluation process in fall, 2014. We held a workshop with a group of instructional designers, directors, faculty, and staff involved in producing quality online courses at our member institutions.  Keen to learn how we could enhance our processes and the experience for members, we openly solicited feedback on the standards, the rubric and our course review process. We learned that there was overall acceptance and adoption of our standards and that many of our members had created templates to support their curricula development. We also heard about challenges arising from implementation, primarily around a lack of consistency in our reviews, tone, and approach. Collectively, we then adapted our course review approach to be more open and constructive and to provide opportunity for designers to meet with our Quality Manager to discuss a course review. An online survey will complete our evaluation of the Quality 2.0 and will publish the results in Spring, 2015.

Please contact me if you have any questions or would like to discuss our standards with our Quality Team: Tricia.donovan@ecampusalberta.ca

Tricia DonovanTricia Donovan
Executive Director
eCampusAlberta

Categories
Practice

IPEDS Fall 2013: Less than Half of Fully Distant Students Come from Other States

This is the third in a series of three blog posts examining the 2013 IPEDS Fall Enrollment survey and its counts of distance education enrollments.  The first blog focused on the 2013 survey statistics and the second compared the growth between 2012 and 2013.  The survey also asked if institutions enrolled students from other states or other countries. We examine those statistics in this blog post, especially in relation to state authorization regulations.

Russ Poulin

With the addition of Fall 2013 IPEDS Distance Education (DE) data, for the first time we have year-to-year enrollment data to compare.  In theory, this should allow us to see whether institutions are improving their IPEDS reporting for the location of students. However, a WCET and e-Literate study published in September 2014, revealed numerous challenges with IPEDS DE reporting (using different definitions, not reporting some students) and cautioned putting much stock in year-to-year comparisons with the first few years of IPEDS data since data reliability issues remain.

ExDELocationEnrollmentThe IPEDS DE survey requests information about the location of the student only for those students who are “exclusively in DE courses”. This is a relatively small proportion of the total population of online students, representing 13% of all enrollments in both 2012 (see last year’s blog post) and 2013.  All of our analysis on the geographic location of the students is limited to this population of students enrolled “exclusively in DE courses”.

Table 1: Fall 2013 Out-of-State Distance Education Enrollments by Sub-sector

      Students Enrolled Exclusively in Distance Education Courses
Sector # IHEs in Sector Number of
enrollments exclusively in DE courses
% of Total enrollment % enrolled in same state as IHE % enrolled not in same state as IHE % enrolled located outside U.S. % enrolled in U.S., state unknown % enrolled student location unknown/ not reported
Public, 4-year or above 691 620,386 8% 75% 21% 1% 1% 2%
Private, Non-Profit, 4-year and above 1,587 519,588 13% 40% 56% 2% 0% 2%
Private, For-Profit, 4-year and above 761 837,795 62% 13% 78% 2% 1% 6%
Public, 2-year 934 661,494 10% 91% 5% 0% 3% 1%
Private, non-profit, 2-year 88 802 2% 50% 50% 0% 0% 0%
Private, for-profit, 2-year 663 19,138 6% 30% 70% 0% 0% 0%
Totals 4,724 2,659,203 13% 52% 42% 2% 1% 3%

homevoutofstate

 Public Students Primarily Attend Distance Education Institutions in Their Home State

For-profit Students Primarily Attend Distance Education Institutions in Other States

As we would predict, a large proportion of students enrolled “exclusively DE courses” are served by public institutions in their state of residence, 75% for 4-year and 91% for 2-year public schools. These numbers are consistent with last year’s data. We see a decline in in-state enrollment in the Private, Non-Profit 2-year IHEs from 61% in-state in 2012 to just 50% in-state in 2013. Private For-Profit 4-year IHEs report a consistent 13% of online enrollments as in-state, while their 2-year counterparts report a small increase from 26% in 2012 to 30% in 2013.

About One in Five Public Four-year Students are Located in Other States

Public institutions report that about 20% of their fully online students are from another state for 4-year IHEs and about 5% are fully online for 2-year schools. This data appears to be consistent between Fall 2012 and Fall 2013 reporting. Private Non-Profit 4-year OneinFiveinOtherStates
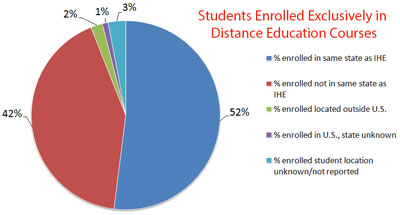
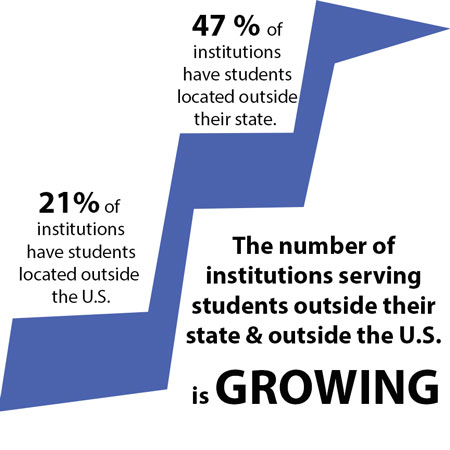
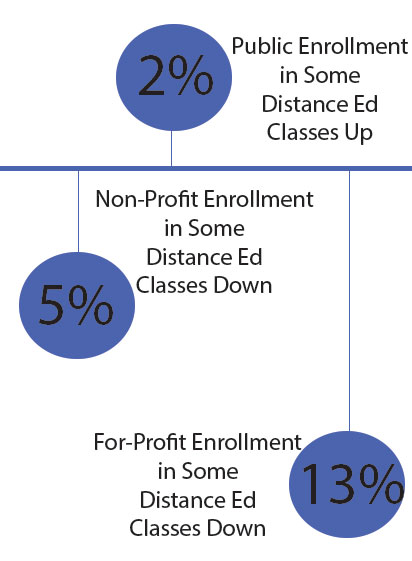
institutions reported 54% of their fully online students were in another state in 2012 and 56% in 2013, again this appears to be consistent data.  There was growth in the reported number of fully online enrollments between 2012 (576,615) and 2013 (620,386). So while the proportion of enrollments reported as “not in the same state as the IHE” remained relatively constant (20% in 2012 and 21% in 2013) there were approximately 15,000 more out-of-state enrollments reported in 2013.

For Profit Institutions are Enrolling a Smaller Percentage of Out-of-State Students

We see some variation in reporting in the For-Profit sector. Private, For-Profit 4-year institutions reported that 84% of their “exclusively DE” enrollments were from another state in Fall 2012 and that has dropped to 78% in Fall 2013. In the same timeframe, Private, For-Profit 2-year IHEs reported a small decline from 73% in Fall 2012 to 70% in Fall 2013. These decreases are consistent with the overall decline in student enrollment in the Private, For-Profit sector reported for the period.

GlobalstudentsColleges are Serving Very Few International Students via Distance Education

The proportion of institutions reporting that they serve students who are outside the U.S. remains small, no more than 2% in any sector. This reporting does not appear to have changed significantly between Fall 2012 and Fall 2013. Based on Fall 2013 data, international students who are served exclusively online number about 26,600. The institutions who serve these students need to have clear policies, procedures, and services in place for these students. Institutions also need to be aware of any laws of the students’ country of residence and need to comply with those laws.

Public Colleges Improving in Reporting the Student’s Location

Overall, we do not see improvement in the proportion of online students for whom their location is reported as “in US, state unknown” or “unknown/not reported”. In both 2012 and 2013, the total in that category remains about 4% of all “exclusively DE” enrollments.

We see improvement in the Public sector reporting of the location of students, as those in the “unknown” categories fell from 4% in 2012 to 2% in 2013. There is a concerning increase in the proportion of reporting “unknown/not reported” by Private, For-Profit 4-year schools. The Fall 2012 data showed just 1% “in US, state unknown” and 1% “unknown/not reported”, while 2013 data 1% for “in US, state unknown” but 6% for “unknown/not reported”.  While this is a large gain, it is largely attributed to a reporting anomaly in a single institution.

It should be noted that the reporting methodology inconsistencies of even one large IHE can affect the percentage results since the numbers are relatively small. For example, in Fall 2013 a large for-profit institution reported almost 50,704 out of 52,131 exclusively online enrollments as “unknown/not reported.” This single campus accounts for 59% of the “unknowns” reported for the sector. Curiously, the same campus reported only 298 students as “unknown/not reported” last year, and another 500 as “in US, state unknown.” As long as IHEs are not consistent with their reporting methodology from year to year, the data on student location remains unreliable. This is unfortunate, since there is much attention on state authorization and compliance. We need good data to understand the magnitude of the state authorization challenge.

Institutions That Don’t Know Student Location Tend to Remain Uninformed

UninformedAmong the concerns with IPEDS DE data reporting includes the fact that some institutions simply do not report the geographic location of their students. Rather, they report the entire population of “exclusively DE” enrollments as “location of student unknown/not reported.” The Fall 2013 data reveals that some institutions continue to report their entire population of “exclusively DE” enrollments as location of student is “unknown/not reported,” others report a large proportion of their online enrollments this way. The IHEs reporting this way are a combination of For-Profits and Publics.

An analysis of the IHEs reporting the largest numbers of enrollments as “unknown/not reported” in Fall 2013 shows that some of these schools used the same reporting methodology in Fall 2012, but some actually seemed to have a had a better handle on where their students were in 2012 than they did in 2013. This, again, points out the importance of using accurate and consistent methodology from year-to-year within an IHE as well as the need to improve the methodology of the schools that continue to not report where their online students are physically located.

Bottom line:  If an institution does not know where its students are located, it cannot possibly be in compliance with state authorization regulations.

The Number of Institutions Serving Students Outside Their State and Outside the U.S. is Growing

GrowingoutsidestateInstitutions in each sector reported the number of distance education students they enrolled either outside their state or outside the US. According to the data (see Table 2), 47% of the IHEs reporting (2,249 of 4,724) indicate that they have students outside their state. This represents an increase of 100 institutions reporting students outside their state borders from last year. In addition, 21% of institutions (1,008 of 4,724) indicate that they have students located outside the U.S, as compared to 940 institutions reporting having students from outside the U.S. exclusively in DE courses in Fall 2012. These survey questions are not mutually exclusive, many IHEs have both out-of-state and out-of-country students.

With nearly one-quarter of all institutions responding to the IPEDS survey reporting that they enrolled students exclusively at a distance outside the U.S., it is curious why this those students represents only 2% of the reported distance education enrollments. This is certainly possible as many institutions probably enroll only a handful of students in other countries, but it would be interesting to examine if this might be another source for reporting anomalies.

Table 2: Number of Institutions reporting students outside their state and outside the U.S.

Sector # of Institutions with at least one student reported as Exclusively DE and OUTSIDE their State # of Institutions with at least one student reported as Exclusively DE and OUTSIDE the US
Public, 4-year or above 519 312
Private, Non-Profit, 4-year and above 742 365
Private, For-Profit, 4-year and above 249 82
Public, 2-year 674 244
Private, non-profit, 2-year 8 0
Private, for-profit, 2-year 57 5
Total 2,249 1,008


More Institutions are Subject to State Authorization Regulations in Other States

Regulations in many states require that institutions who enroll students in their state are required to seek state authorization, request an exemption, or perform some other act authorizing the institution to operate in the state. Based on the number of institutions reporting students outside their state and/or outside the US, there are a great number of institutions that should be seeking state authorization in the states where they serve students. Institutions that do not know where their students are located simply cannot be in compliance with state authorization regulations. Since the IPEDS DE survey does not ask about the specific states in which their students resided, it is impossible to determine from the IPEDS data how many institutions may be out of compliance.

As seen in our survey of institutions regarding their progress on obtaining authorizations, only 25% of responding institutions possess all the approvals that they need.  Since that survey, the Department of Defense has required all institutions offering Tuition Assistance for military personnel to have obtained the authorizations in each state.  The Department of Education has said that they plan to bring back their own federal requirements for students collecting Title IV funds in other states.  The State Authorization Reciprocity Agreement will require reporting of student enrollments at a distance in each SARA state.  Given all these pressures, institutions should be incentivized to provide clearer data on the locations of students in future years.

The analysis of the reported location of students in relation to the institution that serves them continues to show that some institutions are not reporting geographic location data. Either they are not collecting the data at the time of enrollment or they do not have mechanisms to accurately report student location. These institutions need to know the location of their students to ensure that they are in compliance with the state regulations in each state that is home to their students.

This concludes the current series examining Fall 2013 Distance Education IPEDS data. WCET will continue to monitor the data as it is released. We are hopeful that as institutions all adopt the IPEDS definition of distance education and as they gain the systems and experience to pull and report accurate student data, the industry will soon have a true benchmark.


Terri StrautTerri Taylor Straut
Ascension Consulting


Russ PoulinRuss Poulin
Director, Policy and Analysis
WCET


If you like our work, join WCET!

Categories
Practice

IPEDS Fall 2013: Distance Education Data Reveals More Than Overall Flat Growth

The first blog post in this series analyzed the Fall 2013 distance education enrollment data (as released by the U.S. Department of Education’s IPEDS survey) sector-by-sector. The post revealed that one-of-four students took at least one distance education course and that public institutions continue to remain the largest provider of DE courses.

While the 2012 IPEDS survey provides a shaky base for comparison, let’s see what we can learn.  Again, thank you to Terri Taylor Straut for the deep dive into these data.

Russ Poulin

For the first time, we have two sets of IPEDS Distance Education (DE) data. The industry is anxious to have benchmark data that will help us determine trends in the marketplace.

While we still have grave reservations over the accuracy of the IPEDS data reported (some colleges used different definitions, some did not report all enrollments), the data set is the most comprehensive and bears examination.  The biggest caveat is this:  Given the errors that we found in colleges reporting to IPEDS, the Fall 2012 distance education reported enrollments create an unstable base for comparisons.

EnrollmentsDownwebA new concern for the comparison of data by educational sector between Fall 2012 and Fall 2013 is the fact that many institutions have changed their IPEDS identification numbers and how they report. For example, in Fall 2012, all DE enrollments for the Arizona State University were reported through a single IPEDS number, in Fall 2013,  five separate campuses reported DE enrollments. Anyone who wants to dig into the data for themselves needs to be aware of these changes in the data set.

With these caveats, let’s take a look at the data regarding overall higher education enrollments as that will provide context on trends in distance education enrollments.

Overall Higher Education Enrollments are Down 4%

There is Significant (17%) Retrenchment in For-Profit College Enrollment

It is important to understand the enrollment trends by sector. The table below shows that while all sectors report declining enrollment, between 2012 and 2013, the retrenchment in the For-Profit sector, with a decline of 17%, is significantly greater than the other two sectors.

Table 1: Total Enrollment by Sector 2012 to 2013

2013 2012 % Change
Public     14,745,558 15,085,798 -2%
Private, Non-Profit        3,974,004       4,118,688 -4%
Private, For-Profit        1,656,227 1,932,857 -17%
Total     20,375,789 21,137,343 -4%


Overall Distance Education Enrollment Growth Was Relatively Flat

Distance Education Grew Despite Declines in Overall Higher Ed Enrollments

Comparisons of overall IPEDS enrollment data for Fall 2012 and Fall 2013 reveal no growth, or a slight decline (-1.3%) in total student enrollments. Analysis of the IPEDS categories, “exclusively enrolled in DE courses” and “enrolled in some but not all DE courses” reveal increases in enrollment of less than 1%. Given the known problems with IPEDS data validity and the fact that these changes are so small, we conclude that there is no growth in higher education DE enrollments for the first time since this data has been reported. Phil Hill’s blog on this topic provides additional detailed analysis.

Table 2: Annual DE Enrollment Comparisons

All Students Enrolled Exclusively DE Courses Some but not all DE Courses At Least One DE Course At Least One DE Course as % Total Enrollment
2012 20,642,819 2,653,426 2,842,609 5,496,035 26.6%
2013 20,375,789 2,659,203 2,862,991 5,522,194 27.1%
% Change -1.3% .2% .7% .5% 1.8%

FullyDistanceEnrollmentsweb


Fully Distance Ed Growth Varied Greatly by Sector:

  • Non-profit Enrollments Grew by Almost 9%.
  • Public College Enrollments Grew by a Modest 2.4%.
  • For-profit Enrollments Fell by 8.3%.

Combining all the enrollments from each sector provides an incomplete picture of the distance education trends.  For many reasons, the for-profit sector is in a major retrenchment mode.  Their fall enrollment decline (71,154 fewer fully distance students than last year) is dragging down the other two sectors.

Most notable is the growth in fully online enrollments in non-profit institutions.  Their fully distance enrollments grew by almost 47,000, which is almost 9% more than last year.  This is especially notable in the context of overall enrollment in public colleges, which fell by 4% from year to year.  Non-profit institutions have fewer students and many of those that they are retaining are going online.

The change in fully distance enrollments in Public colleges is relatively flat at 2.4%, but occurred at the same time that Public colleges lost 2% of their enrollment.

Table 3: Percentage Change (2012 to 2013) in Distance Education Enrollment for Students Enrolled Exclusive at a Distance by Sector

Sector Exclusively DE Courses 2013 Exclusively DE Courses2012 % Change
Public 1,281,880 1,251,398 2.4%
Private, Non-Profit 520,390 473,941 8.9%
Private, For-Profit 856,933 928,087 -8.3%
Total 2,659,203 2,653,426 0.2%

SomeDistanceEnrollmentsweb


Enrollment in Some But Not All DE Courses is Also Mixed by Sector:

  • Publics Enrollment in Some DE Courses Grow 2%
  • Non-Profits Lose 5% of Enrollments in Some DE Courses
  • For-Profits Lose 13% on Enrollment in Some DE Courses

While the combined reporting shows a very small gain in enrollment of .7%, the differences among the sectors in these categories is significant. Publics maintained growth of about 2% between 2012 and 2013. Non-Profits report a loss of about 6% in this category of DE enrollments. The For-Profits report the greatest loss at nearly 13%. Once again, sector analysis reveals significantly different results.

Table 4: Percentage Change (2012 to 2013) in Distance Education Enrollment for Students Taking Some (But Not All) Distance Courses by Sector

Some But Not All DE Courses 2013 Some But Not All DE Courses 2012 % Change
Public      2,462,362         2,409,595 2.1%
Private, Non-Profit         275,020            291,144 -5.9%
Private, For-Profit         125,609            141,870 -12.9%
Total      2,862,991         2,842,609 0.7%


Combined DE Data Reveals Enrollment Growth in Publics 2.2% and Non-Profits 3.8%

Only For-Profits Lost DE Enrollment Overall at -9%

The final category of DE enrollments, “at least one DE course”, is calculated by adding the IPEDS categories “exclusively DE courses” and “some but not all DE courses”. The combined data reveal that only For-Profits actually lost DE enrollments, overall, between 2012 and 2013. Both Publics and Non-Profit overall DE enrollment actually grew during the period. This is another case where the sector analysis shows a very different picture than looking at combined data alone. While overall there is no significant growth in DE enrollments, it is clear that the growth in Publics and Non-Profits is actually negated by the decline in For-Profit enrollment.

Table 5: Percentage Change (2012 to 2013) in Students Taking At Least One Distance Education Course by Sector

At Least One DE Course 2013 At Least One DE Course 2012 % Change
Public        3,744,242         3,660,993 2.2%
Private, Non-Profit            795,410            765,085 3.8%
Private, For-Profit            982,542         1,069,957 -8.9%
Total        5,522,194         5,496,035 0.5%


Large Players Enrollment Changes Impact Total Enrollment

Closer evaluation of the largest institutions in the distance education market, measured by student enrollment, reveals interesting results. There is large variations year-to-year of reported student enrollment in “exclusively DE courses” by some of the largest players in the market place. With large sums of money being spent on advertising by public and private schools alike, the winners and loser are a bit surprising.

Table 6: Institutions with Large Variation in DE Enrollments between 2012 and 2013

Institution Total 2013 Enrollment 2013 Exclusively DE Enrollment 2012 Exclusively DE Enrollment % Change
For- profit Institutions
Grand Canyon University           55,497           45,496 28,417 38%
Kaplan University-Davenport Campus           52,407           52,131           44,678 14%
University of Phoenix-Online Campus        212,044        207,060        250,600 -21%
Ashford University           58,104           57,235           76,722 -34%
Non-profit Institutions
Southern New Hampshire University 28,389 20,701 10,679 94%
Western Governors University           46,733 46,733           41,369 19%
Liberty University           77,338           64,503           61,786 4%
Public Institution
Arizona State University—All Campuses 76,728 9,958 7,444 34%


University of Phoenix-Online Campus maintains the number one ranking, by far, with 2013 total enrollment of 212,044 students; 207,060 are reported as fully online. However, they lost 21% of their enrollment in just one year. The other big loser in reported enrollments is Ashford University with a 34% enrollment decline, from 76,722 online enrollments in 2012 down to 57,235 enrollments in 2013.

Big enrollment winners during the period 2012 to 2013 include Private, Non-Profits. Western Governors University reported 19% online enrollment growth, with 2013 enrollments at 46,733 and Liberty University reported a 4% gain, growing to 64,503 fully DE enrollments in 2013.

Among the largest schools, Grand Canyon University, a Private, For-Profit shows the highest growth for the period at a 38% enrollment increase from 28,417 online enrollments to 45,496 in a single year, Kaplan University, also Private, For-Profit reported a 14% enrollment increase, and 52,131 exclusively DE students.

Does Advertising Work?

The public reporting and the Fall 2013 IPEDS data support the fact that some of the large For-Profit players are retrenching and have experienced significant enrollment decline. We were curious to see if the increased advertising that we are seeing from some of the smaller institutions is resulting in enrollment gains.

SNHUad1webArizona State University, a Public IHE, has been actively seeking students from outside Arizona through radio advertising, billboards, etc. According to their IPEDS reporting, ASU increased their online enrollments by 34% between 2012 and 2013, resulting in nearly 10,000 exclusively DE enrollments in 2013. A private, non-profit institution, Southern New Hampshire University, reported a whopping 94% enrollment growth in fully online enrollments in the same period, nearly doubling those enrollments from 10,679 to 20,701. While far from a scientific sampling, it does appear that targeted, effective advertising can have a significant impact on enrollment growth. What is not publicly known is the cost to gain those increases in enrollment.

The next blog in the series will focus on the data reported with regard to where the students who are in exclusively DE courses are physically located in relation to the geographic location of the IHE serving them. This is important information for institutional leaders responsible for compliance; regulators and policy-makers who are working to create a more manageable state authorization process.


Note: We erroneously listed Southern New Hampshire University as a public institutions in the second-to-last paragraph.  That has been corrected. (03/16/15)


Terri StrautTerri Taylor Straut
Ascension Consulting


Russ PoulinRuss Poulin
Director, Policy and Analysis
WCET