Categories
Practice

Instructional Designers: Instead of Saying “No” to Faculty, Let’s Say “Yes”

Instructional design has a problem.  I noticed it last summer when I was doing the conference circuit. We have run out of things to say.  Keynotes, which are supposed to rally the troops and get us fired up for the day, offer only platitudes.  Sessions are dull, lifeless. Birds of a Feather sessions never take flight.

Instructional design has stagnated.

How Did We Get Here?
It took me a while to understand why.  After all, we are living through the middle of an upheaval in online and hybrid education in higher ed.  After years of second-class status, online courses have finally become part of most college students’ experience for at least one class.  Even traditional, face-to-face courses use online content regularly.  We made it, or at least we are making it.

Obviously there is good work happening in instructional design.  We are working in the most innovative sector of higher education today.  Yet the problems we each face in our own ID shops across the country point to the underlying problems facing the field.  First, many faculty still do not trust online education. Second, students tend to choose online classes because of their schedules, not because these are “great classes.”

I think these two problems are related, and I think instructional design is causing them.

Instructional Design Starts with “No”Warning sign that reads: "Red Signal Ahead When Flashing"
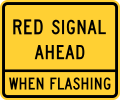
Today’s instructional design models are hamstrung because they make the mistake of starting with “no.”  To the faculty we say “no, you can’t run the class the way you always have.” “No, your objectives aren’t measurable.”  “No, you can’t change things on the fly.”  And we say these things for good reason.

Online and hybrid classes feel like special cases.  The delivery is different, so the courses must be different too.  Measurable objectives can be very important because they are tied to accreditation and funding.  Having a course fully built before students arrive can be critically important, especially if there is a question about whether they will ever get finished at all.

But when we walk in to a faculty member’s office and start with “no,” we lose too much.  We lose the opportunity to learn who that person is as a teacher.  When we focus on our list of “no’s,” we don’t give them an opportunity to show us what they are good at and how we can translate that skill and passion to a new medium.

I’ve been working in instructional design a long time.  I know the biases that many designers have.  I’ve heard more than one of my peers posit that even face-to-face classes would be better if we could get our hands on them.  If faculty sometimes feel insulted by a designer’s suggestions, they probably have a good reason.  A healthy sub-group of designers assume that most faculty are not good teachers, and are not interested in teaching well or improving.

Think about that. If I started this blog with “you probably don’t want to be a better instructional designer” would you listen to anything I have to say? Not likely.  Whether you want to improve or not, I’m not going to get your attention and buy-in if I assume that you don’t.

And doesn’t that make sense?  When we start with “no,” we never learn the best our faculty have to offer.  When we design around “no” we get what we ask for.  We get something less. Then we give that lesser product to the students.  Is there any wonder why students don’t choose online classes because of their inherent worth?

Warning sign reading: "Stop on Red Signal"How Do We Fix This? Green Light Design
I propose a change in attitude.  My coworker, John Jones, and I have worked together to begin designing a new model for instructional design we are calling “Green Light Design.”  We propose turning today’s red lights to green.  We propose starting with “yes” and not “no.”

We have been using the Green Light philosophy at Wichita State for over a year now, and it seems to be working.  When we start an instructional design project, we never begin with talk of rubrics, measurable outcomes, or specific tools.  All of those conversations lead to early no’s. Instead, we sit down and ask “what do you love about teaching?”  “What do you want your students to learn?”  “Tell me, if I could give you everything you are wishing for, what would that look like?”

We start with “yes.”

By starting out this way, we make our faculty the experts, and we communicate that we respect what they do.  In turn, they quickly come to respect our design experience, our technical expertise, and our willingness to listen.  We give them our attention, and they give us theirs. And the courses we design together are better for it.

If you would like to try to adopt a Green Light philosophy, let me suggest you think through our LEARN model.  LEARN got its name because the word “learn” has gotten such a bad rap as not being measurable.  Believe me, an outcome or objective that uses the verb “learn” is not going to make it through many rubric processes.  But I like the idea that it’s our job to help people learn, so we used it to remind us how we like to design courses:Warning sign that reads: "New Signal Ahead"

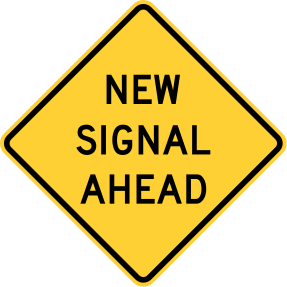
  • Listen:  Always start any instructional design project by listening to your faculty.
  • Envision: Blue sky your design.  Don’t limit yourself to what your tools can do, to what your rubrics insist upon, or to what you have done before.
  • Adjust:  Choose what you can do now, and start there.
  • Revise:  Working with your faculty member, fine-tune what you have, add what you can, and do the hard job of getting things working.
  • Negotiate:  Good design is a long-term project, and both you and  the faculty member are on the same team. What do they want next? What can you do?  Don’t assume that you know what should come next, but don’t assume your faculty member necessarily knows that either.  Both of you need to be in on making the course better over time.

Starting with “yes” has been working for us.  Our boutique designs are leading to excellent courses, and people are getting happier.  It’s possible to get measurable outcomes and well-organized courses this way, I promise.  And along the way, I think you’ll find that if you start with yes, you and your faculty are going to have much more fun.Carolyn Schmidt

Carolyn Speer Schmidt
Manager, Instructional Design and Technology
Wichita State University
carolyn.schmidt@wichita.edu


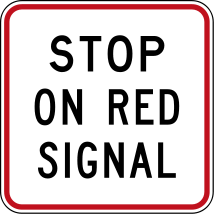
Photo credit: https://commons.wikimedia.org/wiki/Category:Traffic_signal_signs


Categories
Uncategorized

Attracting Returning Adults: The Right Messaging Helps You Do the Right Thing

If you talk to an academic advisor about degree completion for any period of time, you will hear heartbreaking stories of the students who “got away” (students who got close to the goal of graduation but had to stop for a variety of reasons). More than likely, the advisor has reached out to these near completers on numerous occasions to try to assist them in returning to finish their degree requirements, but life continues to get in the way.

Perhaps it is the rising cost of attendance that prevents the return or perhaps the student has relocated to another state making in-class attendance impossible. In some cases, the students eventually return to finish. However, the true heartbreak is that many students don’t return and give up on the dream of becoming a college graduate.

We Learned from Failed Initiatives
In 2011, the University of Memphis launched a recruitment campaign called Back on Track which targeted this population of near completers. While we experienced moderate success at getting students interested in returning to the institution, there were not significant jumps in enrollment or graduation in the following semesters.  In the spring of 2013, another campaign called Experience Counts highlighting our Prior Learning Assessment (PLA) opportunities again garnered interest but failed to result in a substantial rise in enrollment numbers.

Obviously, we needed to re-calibrate and ultimately discovered that our main flaw was bringing the students back to tell them the same message that they already knew. They knew what they needed to complete and all of the challenges associated with that completion; that’s likely why they left or have stayed away. It also began to weigh on us that, as an institution, we were co-conspirators in the fact that a student almost gets to graduate but then stops, often times saddled with debt without a credential to show for it. We resolved to change the message and design a program that would allow students to explore how their completion could be achieved differently.

A New Approach: The Finish Line Program
In the fall of 2013, we piloted a degree completion initiative with one advisor in one department that flipped the “come back” message to students which would explore ALL possible degree completion pathways, evaluate all PLA strategies, and determine eligibility for a one time scholarship. It was ultimately an opportunity for the student to re-imagine what degree completion could be without all of the previously experienced challenges.Table reading: Average number of credit hours needed for graduation: 10 hours; Average cost of completion: $1,800.

Within a few months, 50 students had re-enrolled and 17 students had graduated. Administrators were pleased with the early results of the pilot, and the Finish Line Program was launched at the institution level with a staff of two full time academic advisors and a program director.

Thus far, almost 500 students have been re-recruited back to the institution generating over 2,000 credit hours for the institution. More importantly, 172 students have graduated and fulfilled their goal of earning a bachelor’s degree.

Lessons Learned
First and foremost, we have learned to be ready for almost anything. It’s been surprising to discover students who just aren’t “interested” in completing their degree even when there are flexible, low-cost, efficient completion plans available. In some cases, students are embarrassed to admit that they have not finished their degree, particularly if family and friends thought otherwise. Other students thought their departure would remain “anonymous” especially in an institution of our size with over 20,000 students.

Regardless of the situation or perceived situation from the student’s perspective, it is important to try to understand where they are before you try to sell them on the message that they should return. The comfort of not having to face the challenges again can discolor even the best of news from the best of sources.

Logo for University of Memphis Finish Line ProgramSome other lessons that we have learned:

  • Conduct a thorough evaluation of the academic record before contacting the student and identify any PLA opportunities, curriculum changes since they last attended, and any other degree completion options. Remember you have to tell them something that they didn’t already know to get them interested in returning.
  • Empower the academic advisors to question everything that could benefit the student. Has all of the transfer coursework been evaluated? Is it possible to ask the department chair for a course substitution in certain categories? Could a graduation requirement be waived under certain circumstances?
  • Centralize and customize support services around this population especially since they have already left the institution at least once; don’t give them another excuse to leave before finishing. Our academic advisors are really more like completion concierges; they stay with a student from the point of re-entry all the way through graduation.
  • Measure progress as you go and encourage students even in the small victories like completing their first class or even scheduling a tutoring appointment. Life will continue to get in the way for many of these students, but make sure that you provide as much constant reassurance as possible that the end goal of graduation is still in sight.
  • Realize that it will take time. The process of re-recruiting students is not easy, and the effort required to keep them engaged and progressing to graduation is time consuming. Our advisors serve several roles from re-enrollment counselor to academic coach so be sure to caution administrators against the “low hanging fruit” mentality – the belief that there will be large gains from this group with low investments of time and resources.

Perhaps the most important lesson is to not give up on these students or your efforts to re-engage them in the important work of completing their degree. If we had dismissed our efforts in those early campaigns, we would never have discovered the importance of changing our re-recruitment messaging. Also, we would have lost the opportunity to change the lives of our 172 graduates and their families, as well as the community, state, nation and world in which they live.Tracy Robinson


Tracy P. Robinson
Director, Innovative Academic Initiatives
University of Memphis
tprobnsn@memphis.edu

Categories
Uncategorized

Teacher Prep Regulations and Distance Education: We’ll Soon Need Your Input

The U.S. Department of Education’s long-delayed “Teacher Prep” regulations look like they will soon be back in the limelight. In a subtle addition to the Department’s web page that tracks the progress of this proposed regulation, the following statement was recently added:

“We have formally submitted a supplemental Notice of Proposed Rule Making to the Office of Management and Budget for review that will allow us to collect more public comments specifically on distance education as it relates to teacher preparation. Following the Office of Management and Budget review, we will publish the supplemental NPRM in the Federal Register for public comment.”

Old picture of a teacher in front of a class of young students. Many of them are raising their hands eager to answer a question.
Do graduates of your Education programs inspire learning in students? The Department of Education wants to know.

What Does this Action Tell Us?

This gives us a couple insights:

  • The Teacher Prep regulation is not dead. This regulation has taken many years to develop. When the regulations were first published for public comment, I heard that the resulting submissions were much greater in volume than normal and were overwhelmingly negative. The final regulation was due to be released last year, but was delayed several times. There was some thought that it might never see the light of day. If they are asking for comment, then it is still in play.
  • Our distance education comments had impact. I blogged on my concerns shortly after the regulations were published for comment. WCET partnered with the Online Learning Consortium and the University Professional and Continuing Education Association to submit a formal joint statement. At the time we submitted, we did not find anyone else who had commented on the distance education impact of the proposed language. So far, this is the only issue for which the Department is re-opening comments regarding Teacher Prep regulations.
Picture of a tape measure unrolling.
How do you measure teacher effectiveness?

Why Should You Care?

If you are at an institution that serves pre-licensure education students in other states, then regulation (as proposed) would add requirements for you. Chief among them would be the need to report on several “indicators.” Here’s a summary that was in the last set of proposed regulations, but what will now be proposed might have changed:

  • Student Learning Outcomes. The state would need to measure student growth for students in classes taught by “new teachers” in “tested grades and subjects” (scores in mandated state assessments) and in “non-tested grades and subjects” (measures that are “rigorous and comparable across schools and consistent with State requirements”).
  • Employment Outcomes. These include measures of teacher placement rate, teacher placement rate in high-need schools, the teacher retention rate, and teacher retention rate for high-need schools.
  • Survey Outcomes. The regulations will require reporting on surveys including: a) survey of new teachers to see if they felt their program prepared them to teach, b) an employer survey to capture perceptions of whether the new teachers that they have employed possess the skills needed to succeed in the classroom.
  • Accreditation or Alternative State Approval. The provider needs to determine if: a) “the teacher preparation program is accredited by a specialized accrediting agency recognized by the Secretary for accreditation of professional teacher education programs” or b) meets other state criteria for alternative programs that are too long to list here.

While these requirements for the state to provide the results of these “indicators,” the only way for the state to get the data is by requiring the institution to provide it. If you serve students in several states via distance education and each state has different ways to measure these “indicators,” that could put significant burden on you.

What Should You Do?

We do not know exactly what language the Department might propose or what questions they might ask of us until they release the call for public comments. I’m not sure exactly when that would be, but it will likely be in the next few months.

I suggest opening a preliminary “heads-up” conversation with your leaders in your Education programs that serve students at a distance. You can review the recommendations that we made in our official comments from January 2015. Once the public comments are released, consider submitting your own official comments, participating in commenting through professional organizations within Education, or submit your observations and recommendation to me for consideration for our next round of official comments.

We will keep you posted on next steps.Photo of Russ Poulin with a bat.

Russ Poulin
Director, Policy & Analysis
WCET (WICHE Cooperative for Educational Technologies)
rpoulin@wiche.edu


If you are not a member, come join WCET.

Photo credits:
Teacher with Kids Raising Hands: Public Record Office Victoria.
Tape Measure: Morgue File.

Categories
Practice

Teaching the Whys of Where: Enhancing Understanding Through Geography

Thank you to Allison Friederichs (Associate Dean for Academic Affairs, Assistant Teaching Professor, University College \ University of Denver) for recommending an innovative adjunct faculty member for today’s guest blog post. I think you will enjoy learning from Joseph Kerski. Thank you Joseph for sharing your experiences.  — Russ Poulin, WCET.


Think about major societal issues that we are asking students to understand in higher education, and grapple with and solve in the 21st Century workplace.  What issues come to your mind?  In my discussions with students, we typically generate a list that includes water quality and quantity, climate, human health, food security, biodiversity loss, sustainable agriculture and tourism, energy, natural hazards, political instability, transportation, education, population change, and economic viability.

But no matter what the final list includes, the point I then make is that all of the major issues of our time are related to geography.  Not only do they all occur somewhere, but the issues have specific geographic patterns, linkages, relationships, and trends.  In short, they can all be better understood through the spatial, or geographic, perspective.

This perspective is important to teach not only in sciences related to earth and environmental studies, such as biology, geology, anthropology, and geography, but in history, language arts, mathematics, engineering, planning, criminal justice, medical sciences, business, and many others.  As the above issues grow in importance on a global scale, they also increasingly affect our everyday lives. To grapple with these issues requires graduates that have a firm foundation in spatial thinking, skills, and foundations; those who can see the “big picture” but that understand how different patterns and trends are related from a global scale down to the local community.

Advancing from Folded Maps to a Modern Geographic Information System

To understand these patterns and trends requires the ability to map data within a geographic information system (GIS) environment.   Far from being musty paper documents tucked away in a back corner of the classroom or workplace, maps are more relevant to education and society than ever.  Today’s maps and tools are in digital form running in the data cloud in a “software as a service” mode, much like Google or Microsoft online documents, Dropbox, music services such as Pandora, and business solutions such as salesforce.com.

Map with bullets indicating instances of cholera cases.
Analyzing the 1854 cholera epidemic in London through spatial analysis with live web maps.

Data can be mapped in 2D and 3D, and these maps now allow real-time data to be mapped, such as wildfires and other natural hazards, as well as posts to social media.  These maps can be used in the field and in the laboratory; they are not static; they can be modified.  They can be contributed to via crowdsourcing methods with an ordinary smartphone.  They allow for quantitative and qualitative spatial analysis, such as for proximity studies, routing, map overlay, georeferencing, and geocoding.  They are used daily for more efficient decision making in an increasing number of professions in the 21st Century.

How Do Mapping Tools Fit Into My Courses?

In my online and face-to-face courses while serving as Instructor at the University of Denver, for a variety of other universities, and while serving as Education Manager for Esri (Environmental Systems Research Institute), I ask the students to grapple with such questions as:  What is the relationship between birth rate, quality of human health, and life expectancy? How does acid mine drainage in a mountain range affect water quality downstream? How will climate change affect global food production? What is the ideal location for a specific type of business given the traffic pattern, demographic characteristics, competitors’ locations, zoning, and property values of a specific community?

Geographic questions begin with the “whys of where”.  Why are cities, ecoregions, earthquakes, businesses, and other objects located where they are?  How are they affected by their proximity to nearby things, and by invisible global interconnections and networks?  Teaching with web mapping is an inherently inquiry-driven activity:  Asking deep and relevant questions is the first part of scientific inquiry.  It forms the basis for knowing what types of data to collect, to analyze, and what decisions to make.

Helping Students to Ask the Right Questions…

The maps do not ask the questions.  Rather, it is the student with an instructor’s guidance, developing a firm foundation in understanding historical issues, who can ask these questions.  After asking geographic questions, students acquire geographic resources and collect data, such as maps, satellite imagery, spreadsheets, and data.  These data sets are increasingly from rich online libraries and from their own fieldwork. By analyzing these data, they discover relationships across time and space.

These investigations involve critical thinking, increasingly important in the new era of crowdsourced geographic information.  Not only are agencies such as the World Health Organization, the US Geological Survey, and one’s own local government generating data, but ordinary citizens are increasingly gathering and mapping data.

Geographic investigations can be used to cultivate critical thinking skills, helping students to understand the benefits but also the limitations of data, and how to deal with uncertainty.  Geographic investigations also involve systems thinking, whether the system contains the components of mass transit in a specific urban area, the interconnections between biomes, soil type, and landforms, or the interaction between weather and oceans.

…And Search for Answers That Lead to Additional Questions.

Geographic investigations are often value-laden and examining a problem from all sides. For example, after examining a map of cotton production in the USA, students investigate the relationship between altitude, latitude, climate, and cotton production. They ask, “Why is cotton grown in this area?”  After discovering that much cotton is grown in dry regions that must be irrigated, they can ask, “Should cotton be grown in this area? Is this the best use of water and other natural resources?” Finally, students present the results of their investigations using geographic tools such as Geographic Information Systems (GIS) and multimedia. Their investigations usually spark additional questions, and the cycle that results is the essence of geographic inquiry.

Three maps showing growth over time.
Examining the declining water levels of the Aral Sea in central Asia using infrared satellite imagery in a web mapping environment.

How Can You Add Spatial Thinking to Your Course?

How can instructors foster spatial thinking in their courses?  As part of my interest in helping those outside the university walls to understand why all of this is important, at the University of Denver I recently taught a course entitled “Why Maps Still Matter” for the general public.  For this course, but also for many of my university courses, I focus on hands-on problem-based learning.  The problems included selecting the ideal locations for tea cultivation in Kenya, assessing the most vulnerable populations and areas to flooding in Boulder Colorado, and studying the spread of bird flu across Eurasia for a 12 year period.

To solve the problems, students use data, images, maps, and tools in a hands-on, investigative mode, such as the following:

  • ArcGIS Online allows for population change and demographic and lifestyle characteristics to be examined, from global to neighborhood scale.
  • The Urban Observatory allows dozens of variables in dozens of cities around the world to be compared and mapped.
  • The Change Matters viewer allows for Landsat satellite imagery comparisons to examine how the Aral Sea, Lake Chad, Mt St Helens, Dallas-Fort Worth, the Three Gorges Dam area in China, and other locations have changed over the past 40 years.
  • Business Analyst Online allows for supply chain management, site selection, and other business decisions to be made, and graphs, charts, maps, and reports to be generated from that analysis. Each of these tools involves dynamic web maps that can be accessed, queried, saved, and shared.  They can be embedded in multimedia-rich dynamic resources such as storymaps, that can include narratives, audio, video, field data, photographs, live web maps, and much more.  I have used student-created storymaps as effective assessment and communications tools in instruction.

Maps…Not Just for Geography Classes Anymore

Examining issues through a GIS environment adheres to the core tenets of the Partnership for 21st Century Learning.  GIS is one of the three fastest growing technology skill sets as identified by the US Department of Labor.  Web GIS, in particular, is rapidly being adopted by government agencies, nonprofit organizations, and private industry.

Cultivating these skills builds personal effectiveness competencies (Are you organized?  Are you ethical?), the ability to deal with and grapple with an increasing volume and variety of data, and other skills identified by a community college NSF-funded project resulting in the Geospatial Technology Competency Model.  Students engaged with these technologies and approaches will be better able to use data at a variety of scales and in a variety of contexts, to think systematically and holistically, and to use quantitative and qualitative approaches to solve problems.

In short, as students and then as graduates, they will be better decision makers.  The geographic perspective underpins the critical thinking skills, technology skills, citizenship skills, and life skills that underpin virtually all other disciplines. It is too important to confine simply to geography itself.  Rather, it is essential for enabling students to grapple with the essential issues of the 21st Century.Montage of several maps and students in a field.

Tools, maps, and approaches fostered by the use of dynamic web maps and the geographic perspective in education.  For more information, see my web page, my video channel, the Spatial Reserves blog, and the GIS Education Community blog.  Joseph Kerski laying on a sundial


Joseph J. Kerski, Ph.D., GISP
Education Manager
Esri – Environmental Systems Research Institute
jkerski@esri.com
Twitter:  http://twitter.com/josephkerski


Categories
Practice

Help Guide the Conversation about the Price and Cost of Distance Courses

We need your help in providing data – WCET is currently conducting a survey on the price and cost of distance education. But before we get to the survey completion plea, some background…

How Are You Saving Money Using Technology?

In the ancient days of distance education, back before online courses, I ran a two-way video network that served students across the wide expanses of North Dakota. Each year, I would make the rounds of the colleges to assess educational, technical and support needs across the state.

A group of faculty at a rural university asked for an audience with me. After my talk, one eager faculty person immediately asked, “How will you save money using this technology?”

To which I replied that my video network’s mission was not to save money for the University System. Our goal was to expand access across the state and this would actually cost us money.

The faculty person was stunned for a bit. He paused and thought. Since faculty usually don’t scratch their heads, you could see him doing so in his mind. Then he asked, “Yes, but how will this save money?”

Arrrgh!

That was more than two decades ago. The same preconception arose in an Inside Higher Ed article last week that cited a study that concluded that “prospective students lack interest in online learning.” They cite online learning as a cost-saving tool, but they give no reference.

We Need Better Information on the Price and Cost of Distance Education

balanced scales of justice with Cost and Price in the scalesIn talking to legislators, administrators, faculty, students, and the public in general, we need better information about what we charge students (the “price”) for distance education courses. We also need to know more about how much it costs the institution to create the course (the “cost”).

Maybe distance courses should be priced lower than face-to-face courses….maybe not. In our previous work on this issue, we found that most institutions charged a higher price. However, there were examples of lower priced programs, but the institution had to be intentional in doing so.

Burck Smith, CEO, StraighterLine raises this question often: “In light of massive investments in technology in higher education and K-12, why have prices risen faster than inflation and student outcomes declined? If a technology is being used appropriately, it should result in lower prices, better outcomes or both. What’s different about education?”

Absent data and information, we allow external stakeholders to set the parameters of the conversation.

We Need Your Help in Providing Your Experiences…Take Our Survey

We are currently conducting a survey on the price and cost of distance education. The survey was sent to the official representative of every WCET member institution and to distance education leaders at other institutions.

We would like to receive just one response per institution. We made allowances in the survey for institutions that have multiple price and cost parameters based on the college, department, or program. If you are a completely online institution, the survey is really short. We will share the results of our survey with you, our members.  As well as using the data to fuel our work in advocating for you, our members.

To request a survey link, contact Rosa Calabrese, WCET’s Coordinator of Digital and Product Services.

Thank you,

Russ


Photo of Russ Poulin with baseball bat
Ready for baseball and regulatory season.

Russ Poulin
Director, Policy and Analysis
WCET

Categories
Practice

New WCET Distance Ed Enrollment Report Shows Continued Growth

We are pleased to announce the first issue of a new report, the “WCET Distance Education Enrollment Report 2016: Using IPEDS 2014 Fall Enrollment Data.”

Based on data accumulated by the U.S. Department of Education’s Integrated Postsecondary Education Data System’s  (IPEDS) 2014 Fall Enrollment survey, we decided to create a single report instead of a series of blog posts. The report highlights differences in distance education enrollments by sector, graduate vs. undergraduate study, student location, and by the number of institutions educating students at a distance. Our aim is to enlighten readers about the current state of the industry through graphs, data tables, observations, and commentary based on our insights.Reads "One in Seven Students Learn Exclusively at a Distance"

Our Partnership with Babson Survey Research Group

We are also pleased that we partnered with the Babson Survey Research Group (BSRG) this year. Today they released the latest in their series of reports of online learning: “Online Report Card: Tracking Online Education in the United States.” Through our partnership:

  • BSRG’s “Online Report Card” includes:
    • Highlights of IPEDS enrollment data based on analyses conducted by WCET.
    • BSRG reports on surveys of online learning leaders in the U.S. that they conducted on their own.
  • WCET’s “Enrollment Report” provides additional enrollment results not found in the “Online Report Card.”

BSRG has announced that, in the future, it will wind down its annual online education report. In the future, WCET plans to continue providing insights into IPEDS distance education enrollments. We also will focus on different aspects of the data from year-to-year.

Reads "One in four students are taking at least one distance course."
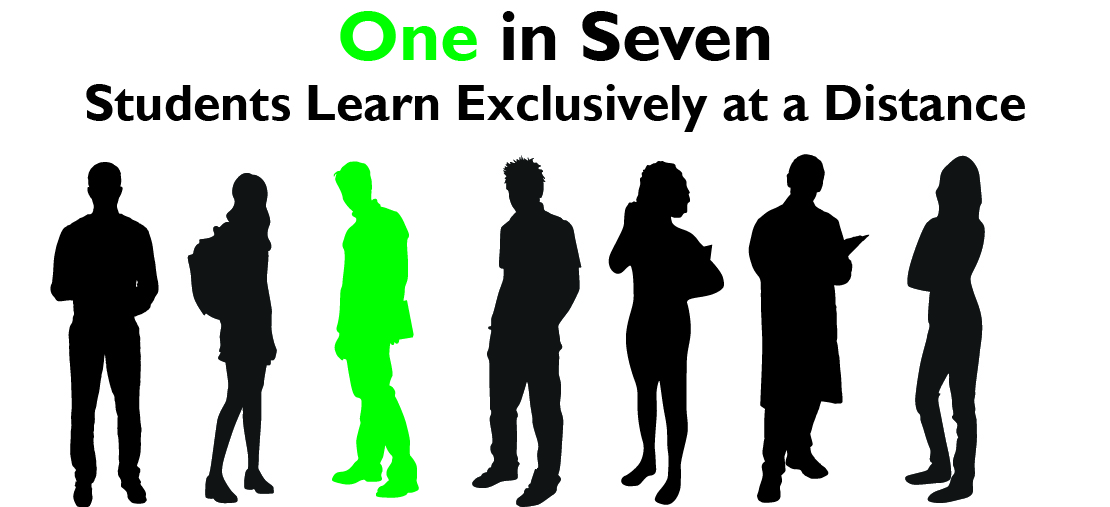
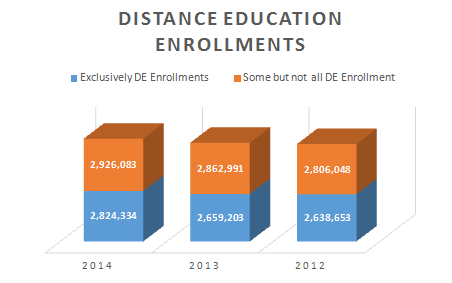
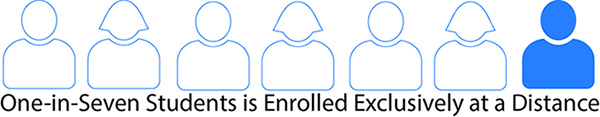
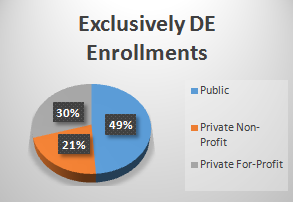
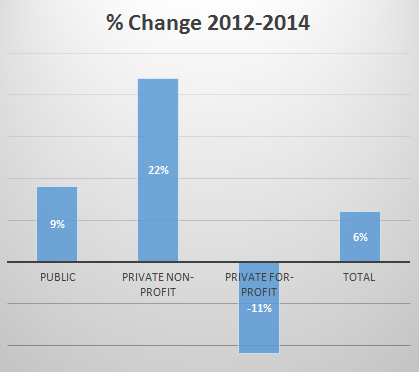
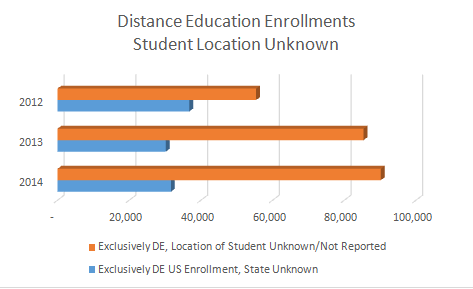
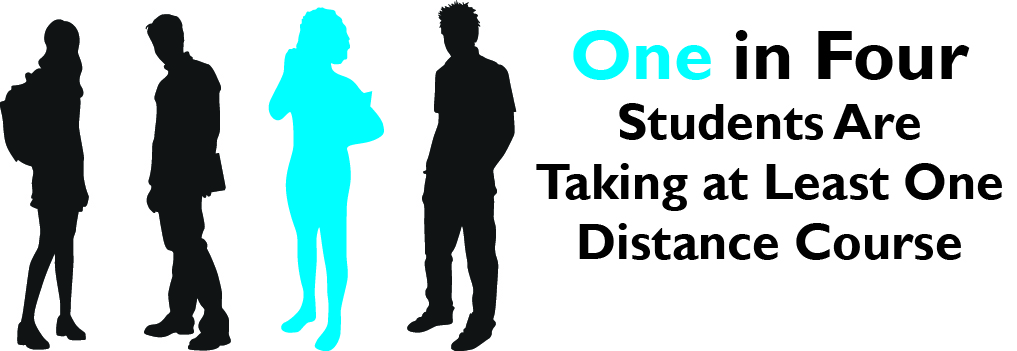
Highlights of Enrollment Analyses

Overall distance education enrollments are continuing to grow from year to year, even as overall higher education enrollments decline. But, you have to look more closely at the details to get a more complete picture for the Fall of 2014. Note especially the difference by higher education sector.

In our report, we again highlight some of the problems with the data collected by IPEDS. Even so, this is the best and most comprehensive data that is currently available.

Distance Education is a Key Component of Higher Education in the United States

One in seven (14%) of all higher education students took all of their courses “Exclusively” at a distance. More than one-in-four students (28%) enrolled in “At Least One” distance education course.

Distance Education Grows while Overall Enrollment Dips

Overall higher education enrollment declined by 2% from 2012 to 2014. Meanwhile, the number of students enrolled “Exclusively” at a distance grew by 9%.Shows the "Exclusively Distance Education Percent Change in Enrollments from 2012 to 2014: Public +12%, Non-profit +33%, For-profit -9%, and Total +9%.

Growth Differs Greatly by Sector

Enrollments for those learning “Exclusively at a distance grew by 12% for the public sector and a remarkable 33% for non-profit institutions. Meanwhile, the number of for-profit students declined by 9% over this same time period.

Of special note is that the for-profit sector almost fell to being the sector with the fewest distance enrollments “Exclusively at a distance. This is a remarkable outcome considering the for-profit sector led the private, non-profit sector by more than one-quarter million (297,521) enrollments in 2012. In 2014, that difference fell to only 422 enrollments.

Identifying the Location of Distance Students Continues to Be a Problem

The survey asks for the location of the student, which is interesting both from analyzing geographic reach of institutions, but also compliance with state authorization regulations. The WCET State Authorization Network helped to support this report.

There was a large increase (66%) in the “Student Location Unknown/Not Reported” category and a decrease (14%) in students reported in the “In U.S., State Unknown” category. The increase may be mostly due to a few large institutions that changed their reporting.

Acknowledgements

Many thanks to Terri Taylor Straut. This is the third year that she has contracted with WCET to perform the dirty work of making her way through the intricacies of the data sets and has helped in providing useful insights.

We also appreciate partnering with Jeff Seaman of the Babson Survey Research Group. Working together we were able to identify new dataset parameters that improved on each of our practices in previous years. Additionally, by dividing the work, we were both able to provide more results for our users than we were able to do working separately.

We hope you enjoy the new report and we look forward to obtaining your feedback.Photo of Russ Poulin with a bat.

Note: We reported some preliminary results in December. Any differences should be due to the changes that we made in harmonizing our data set with that used by BSRG. We suggest using the updated data and analyses in this report.

Russ

Russ Poulin
Director, Policy and Analysis
WCET


If you like what we do, join WCET.

Categories
Practice

The Great LMS Review Adventure

Who wants the best LMS?  We all do!  How do you pick the best LMS?
*cricket chirp, cricket chirp*

A choice of a Learning Management System (LMS) is a critical one for colleges and universities on so many levels – it is the most important academic technology system in the majority of higher education technical infrastructures and has tentacles into every facet of learning and teaching.  This brief post will share some lessons learned from a 14-month long LMS review process at Cuyahoga Community College.

Picture this – a large community college with approximately 23% of FTE attributed to online courses, and another 8% attributed to blended or hybrid courses.  With an annual student population of 52,000, this Midwestern college has a strong shared governance structure with a well-established faculty union.  Now picture this – the college has used Blackboard since 1997.  It’s a “Wild Wild West” model of online courses, whereby faculty can put any course online and there are no systemic processes for instructional design, accessibility, or quality assurance in those courses.

This was the case as Cuyahoga Community College (Tri-C) set off on its adventure of analyzing and selecting the best LMS for Tri-C.

Part of the cover of a brochure used to inform faculty and staff on the LMS Review process. It gives a status that the College was down to the final three: Blackboard, Canvas, and Desire2Learn
This is part of a cover of a brochure used by Tri-C to update faculty and staff on the LMS Review progress.

And that’s an important distinction.  From the very beginning, the premise of the review was not to find and select the best LMS available.  It was to select the best LMS for the college.  Why does this matter?  Culture.  Culture is so critical in the adoption of online learning, the acceptance of its legitimacy and value, and the time and effort put into creating courses and supporting them.  In this strong shared governance culture, it was important that from the very beginning, we weren’t looking for the best system, we were looking for the best fit.  The process that found us that best cultural fit could be broken into 6 primary phases:

  1. Initiation,
  2. Input Gathering,
  3. Needs Analysis and Demos,
  4. RFP,
  5. Testing, and
  6. Consensus Decision Making.

1) Initiation

So why do you want to review your LMS?  Is your contract up and you’re not feeling the love?  Maybe your LMS is being phased out, or you’re unhappy with recent functionality changes.  In the case of Tri-C, we were coming out of a major Title III grant, which funded Blackboard systems.  We also had been a Blackboard school for about 18 years and had a list of frustrations about functionality – specifically system “clunkiness” – that begged to be examined.  And so we did.  Tri-C has several committees that support technology within academics, and this project was initially supported by the Technology Forum Governance Council, a combined committee comprised of members of AAUP (American Association of University Professors) and Tri-C administrators.

From there, we approached the leadership of our Faculty Senate and the AAUP as well as the campus presidents and other critical stakeholders for an initial round of exploratory demos on February 14th of 2013.  We were feeling the love from vendors, getting a lot of insights into the roadmaps of different LMSs, and even a couple add-ons.  Faculty Senate leadership recommended full-time faculty to participate in the year-long LMS Review Taskforce, and every constituent group from administration was included:  IT, procurement, legal, access office, student affairs, and academic executive-level leadership.  We secured a project champion in one of our campus presidents, put together a project charter and got to work.  A full list of taskforce membership can be found on the blog documenting the process, which also included a published list of attendance at Taskforce meetings – transparency was a key component of the process.

Because of the length and intensity of the Taskforce commitment, descriptions of what the work involved were created and disseminated at the very beginning for both faculty and administration and staff.  The expectations were clear, and the Taskforce members committed to the length of the project.

The structure of the project management itself reinforced accountability and commitment.  Small work groups were created of four to five people who could more easily arrange times to get together in between the Taskforce meetings, which occurred every two weeks.  Activities were assigned and conducted in two-week “Sprints,” which enabled us to have a series of small, intensive work timeframes and avoid “initiative fatigue” so common in large institutions.  Each work group had a lead who was responsible for the completion of those activities.  The work group leads determined many of the activities and contributed to the agile nature of the project.  The project plan was flexible, and continually adapted.  This was truly a case of distributed ownership.  The plan adjusted as new ideas were brought forward and new problems were tackled.

2) Input Gathering

Right from the bat we started gathering input.  In a strong shared governance environment, it was critical that not only were faculty voices heard, they drove the conversation, testing and selection.  Our front lines with our students are faculty, and their belief in the best system for Tri-C students would be the critical piece of the decision-making process.

In order to get this party started, we brought in Michael Feldstein and Phil Hill from Mindwires Consulting to conduct a couple of full-day workshops to educate the LMS Review Taskforce so that we would start with a common core knowledge-base around the current marketplace as well as industry trends.  Additionally, Mindwires conducted college-wide surveys of faculty, staff, students and administration as well as focus groups on each campus with the same constituent groups.  It was valuable to use outside experts to come in and support this education process for the LMS Review Taskforce.  It enabled our department – the Office of eLearning and Innovation – to remain the logistical and project management lead rather than getting into the weeds of gathering input.  Additionally, using an impartial outside group ensured that there wouldn’t be any question of influencing that input.  Because that feedback was a snapshot in time, we also created a continuous feedback form that students, faculty and staff could use at any time in the process to communicate with the Taskforce.

3) Needs Analysis and Demos

Immediately, the group jumped into the messy process of listing out the functional requirements in a Needs Analysis.  You can find the messy working version here.  Relatively simultaneous with this, a series of intensive demos were held with each of the five systems that were in the running:  Blackboard, Brightspace by D2L, Canvas, MoodleRooms and Remote Learner (which is also a Moodle hosting service.)  Though it might seem counter-intuitive to conduct those two activities relatively simultaneously, the timing strengthened the needs analysis process, as some of the LMSs that were being demoed had functionality that faculty at Tri-C were unfamiliar with, and decided that they wanted.

We did a comparison analysis of systems, almost an informal RFI process. The needs analysis, combined with the analysis of systems, enabled us to synthesize categories of needs and functional requirements to create the RFP.

4) RFP

The Request for Proposals (RFP) process was conducted by (you guessed it) the RFP Work Group.  In addition to asking for information about the functional requirements defined from the Needs Analysis, questions were added that were future-forward in order to plan for what tools would help make students successful in 3, 4, or 5 years.  We asked about ePorfolio functionality and digital badging capabilities, Competency-Based Education support, gamification potential and integrating in external tools as well as social media.  The resulting RFP was pretty robust.  It was also exhausting to read the results – so be prepared for reading hundreds of pages per vendor.

After the demos and the results of the RFP, a downselect was conducted which eliminated the Moodle-based LMSs.  This downselect was conducted using a defined consensus decision-making process, which I’ll touch on later in the final step.

5) Testing

And then came testing!  A series of sandbox environments were set up in each of the systems – one that was a “blank” course, one that was an import of a course that had a variety of content, and one that was vendor-created.  A rubric was created for testing that was aligned with the RFP (and therefore with the needs analysis.)  The rubric then became a part of the final scorecard that was applied to the remaining systems.

The Student Experience Work Group and Mobile Learning Work Group combined forces to get feedback from students on the remaining systems.  The testing process was one that – upon reflection – I would recommend changes to.  Because the naming conventions in each of the systems are so different, a lot of valuable testing time was spent trying to figure out which functionality was parallel to what faculty had been used to in Blackboard.  This could have been resolved by either changing the naming of tools in the other systems to match what faculty were used to, or by providing training in each of the testing systems.  We did conduct multiple sandboxing sessions on each campus where faculty could stop in and explore the systems together.  Faculty individually filled out their rubrics, which were then fed into the master rubric.  Those results were then fed into the scorecard.

Sample of the LMS Review Master Rubric to grade products on several criteria.
The above was the first tab of an Excel-based rubric. There was a tab for each of the categories which fed into an overall rating. The rating also captured the number of reviewers. All reviewers did not review all tabs; for example, faculty did not review Software/Network Management, and members of the IT group did not review Calendar Integration, Communication/Collaboration, etc. The above numbers are placeholders.
A sample of a part of the LMS Review rubric used to grade the products on Assessments ,Quizzes, Tests, and Exams"
This is an example of one of the tabs that fed into the overall rubric. A full rubric was calculated for each of the LMSs in the running, being tested on the four browsers noted. The rating are placeholders.

6) Consensus Decision Making

It was important from the very beginning of the process – and at the recommendation of Mindwires – that this not be an exclusively quantitative process.  Each institution has a unique culture, and the LMS needs to fit and function within that culture.  The conversation and discussion around the systems needed to be paramount, and this was reflected in the prioritization of the scorecard.

In order to accomplish a truly collaborative process, one without voting that might have traditional winners and losers, we utilized a consensus decision-making tool.  First, the decision is clarified – what solution is being proposed, and what exactly does it entail.  Then each individual involved needs to decide their level of agreement with the solution.  There is discussion, and then everyone determines their level of agreement with the solution.  It ranges from an enthusiastic “1” to a “over my cold dead body” at 6.  The goal is to get everyone to a “4” – which basically says that though that individual doesn’t agree with the decision and wants that to be noted for the record, he or she won’t actively work against the decision.

On this one, everyone weighed in on the selection of Blackboard as a “1” through “3.”  Success.

The most important part of this project, though, was the continuous, unrelenting transparent communication.  This cannot be overemphasized, particularly in an environment of strong shared leadership and governance with faculty.  Transparency is critical for everyone to know that there’s no agenda going on behind the curtain.  To do this, we put together a Faculty Communication Work Group.  There were faculty leads on each campus who were the “go to” people for questions.  They led (and led well,) in partnership with Tri-C’s Interactive Communications department, an assertive communication campaign consisting of emails, videos, Adobe Presenters, posters, articles in the Tri-C newsletter, announcements on our intranet, and (as a throwback option) even paper flyers distributed in inboxes.  The eLearning and Innovation team published regular blog post updates that flowed to a Twitter feed that was embedded within our college portal and the Blackboard module page.  We kept a Communications Traffic Report in order to document the outreach, just in case someone managed to avoid every communication stream.

With the length of time of investment the college had already made in Blackboard, as well as the faculty time invested already in training and course design and development in the current system, Blackboard was the best choice LMS for Tri-C.

Subsequent to this process, we found out that we likely would never have access to Blackboard Ultra as a self-hosted institution.  We explored moving to managed hosting, with the end goal of moving to SaaS and gaining access to Blackboard Ultra, but with the number and length of delays in its development, we decided instead to re-evaluate the system status for sustainability and to see if it still meets the needs of Tri-C in another year and a half.

Yes, that’s what I said.  Revisiting in a year and a half.

The process ended up being an incredibly valuable one despite these late complications.  It revealed a need for redesigned, college-wide faculty training and started the discussion of having shell courses for high-enrollment courses to provide accessible learning objects as resources for faculty.

Though it was exhausting and a nearly obsessive project that took incredible amounts of human resources, it built a robust discussion around online learning and how academics and student needs should drive technology discussions, not the other way around.

Find all the information on the process on our blog here, and search “LMS Review” to get all the historical blog posts. Sasha Thackberry

Sasha

Sasha Thackaberry is the District Director for the Office of eLearning and Innovation at Cuyahoga Community College.  In February she joins the team at Southern New Hampshire University as the Assistant Vice President for Academic Technology and Course Development.  She can be found hanging out on Twitter @sashatberr or at edusasha.com

Categories
Practice

Mind the Skills Gap

In the final chapter of our three-part set of guest blog posts focusing on the future, we welcome Michelle Weise. Formerly at the Clayton Christensen Institute, Michelle now serves as Executive Director of the Sandbox CoLABorative for Southern New Hampshire University. In that role, Michelle focuses on thinking through the challenges and potential partnerships that the university can forge in service of building more affordable and accessible pathways to a high-quality education. Thank you Michelle! – Russ Poulin

= = = = = = = = =

Here we need the Aristotelian distinction between instrumental knowledge and knowledge for its own sake. An education centered in a research university will focus on knowledge for its own sake: knowledge that forms a major part of a fulfilling life.
       –Gary Cutting, “Why College Is Not a Commodity

Make no mistake: Coding bootcamps are on the rise. In 2014, approximately 6,000 students graduated from a bootcamp, and another 16,000 were estimated to have completed in 2015. Major companies such as Facebook, Adobe, Etsy, Google, Goldman Sachs, and the New York Times now recruit highly proficient web developers from these brief, targeted programs that run anywhere from 6 to 15 weeks.

Michelle Weise peering into the future
Michelle Weise

Despite the hefty upfront costs ranging from $10k to $20k for these streamlined programs, coding bootcamps pride themselves on their excellent outcomes, boasting job attainment rates that range anywhere from 63 to 99 percent and notably high starting salaries. Contrast that figure with the 57 percent of people, according to the American Bar Association, who are able to land a job after attending law school.

Could we be witnessing a new form of vocational training? Even massive open online courses (MOOCs) in their latest evolution are moving more towards workforce alignment: Udacity was boldest in its early narrowing of focus to nanodegrees; edX followed with its Xseries, and now Coursera offers various Specializations.

The Obama Administration certainly has been keeping up with these burgeoning, alternative learning pathways that lead to middle- and high-skills jobs in demand today. These nontraditional programs have served as the impetus behind the Administration’s latest invitation to an experimental sites initiative (ESI) entitled, Educational Quality through Innovative Partnerships or EQUIP. Underscoring the importance of connections to skills and work, EQUIP is intended to enable students to access federal financial aid and apply it toward non-traditional providers of education that have partnered with colleges and universities as well as a quality-assurance auditor.

The Education vs. Vocational Training Conundrum

Yet, as alternative learning providers gain traction, we can always count on a recurring line of defense in academia that insists that higher education is and should not be about training students for jobs. Postsecondary education is about learning how to learn for a lifetime and knowledge for its own sake. Tim Johnston from the Council of Colleges of Arts and Sciences captures this sentiment well when featured in a recent article from Inside Higher Ed. He explains that there is a “‘mistaken emphasis’ on a student’s first job out of college. ‘A college education really is a preparation for life, it’s not training for the first job you get,’ he said, adding that most people these days have ‘changeable and unpredictable’ career paths.”Railroad tracks with a sign reading "mind the gap" to warn passengers boarding the train.

Such refrains beg the question: Why do we believe that if a student’s learning is aligned with labor market demand that this will somehow preclude him or her from learning how to learn for a lifetime?

There is an unfair dichotomy—an either/or proposition—between the supposed life of the mind and vocational training. Even if we’re unsure of the payoff of a liberal arts degree, we tend to insist, as Peter Capelli does in a New Yorker article, that there is “‘no guarantee of a payoff from very practical, work-based degrees either, yet that is all those degrees promise.’”

New data from American Institutes for Research (AIR), however, suggests that this is not quite true. Sub-baccalaureate credentials can lead to middle-class earnings and sometimes even exceed the earnings of graduates with bachelor’s degrees. In states such as Colorado, Texas, and Virginia, the earnings of students in associate’s and certificate programs in fields such as Allied Health Diagnostic, Intervention, and Treatment professions, Criminal Justice and Corrections, and Fire Protection—credentials that help students learn how to fix things or fix people—have high earnings: “In Texas, individuals with technical associate’s degrees earned on average over $11,000 more after graduation than did those with bachelor’s degrees. In Colorado, graduates with associate degrees in Applied Sciences out-earned their counterparts with bachelor’s degrees by more than $7,000 and in Virginia by more than $2,000.” Moreover, these earnings premiums are not just for the first year out of school, but true five and ten years out of these programs. AIR has tracked seven different states longitudinally and proves that there are practical, work-based degrees for students that not only lead to earnings premiums but are also in high demand.

There’s more: We’re often shortsighted in the way we characterize that first job. We tend to lament how newly minted graduates find themselves landing lowly retail jobs. According to a paper called “Bridge the Gap: Rebuilding America’s Middle Skills,” produced by Accenture, Burning Glass Technologies, and Harvard Business School, however, great middle-skills career pathways surprisingly begin in what we tend to denigrate as retail work. In fact, these jobs lead to “more robust and diverse prospects for career advancement,” such as management and supervisory roles in logistics, administration, accounting, sales, and customer service. Such competencies and skillsets are not only in demand but they are also cumulative and linked to further learning and growth. So even if an education leads to just a first job, there is immense value in students’ learning vital workforce competencies that will carry them into their second, third, and fourth jobs.

Vocational Training Also Has Long-Term Educational Value

Skills that align with labor market demand are not all one-stop, dead-end pathways. There’s a reason why new learning providers are infiltrating this space. Even online competency-based education (CBE) providers are creating direct business-to-business (b2b) channels with employers. The result? Here’s how one College for America student describes her learning experience:

“I learned about Lean Principles, the Federal Reserve, globalization, and the moral philosophies of Immanuel Kant and John Stewart Mill. I learned about the Renaissance, the Reformation, and the Enlightenment while exploring art from masters such as Giotto, Donatello, Rembrandt, Manet, and Picasso. I studied how the earth cycles water, carbon, nitrogen, and phosphorous; the enormity of the Great Pacific Garbage Patch; and the devastating impact pollution is having on sea turtles, birds, fish, and the overall health of our precious oceans.”

Does that sound like voc-tech?

This is not about training for a single job. Northern Arizona University’s online CBE program called Personalized Learning recognizes that its core mission is to teach students to become autodidacts in a rapidly changing world. They view themselves as teaching students proficiency in how to learn so that if they emerge, for instance, with skills in a specific programming language that is no longer as popular, then they will easily be able to adapt to that change and teach themselves how to learn the next skill. Isn’t this precisely what we mean when we talk about learning how to learn for a lifetime?

Moving Past the Conundrum and the Focus on the First Job

Rick Staisloff explains the conundrum deftly: “The trap is that we think…we are either pursuing the life of the mind or that we are a beauty school…We want students to get immersed in a culture. Well, the workplace is a culture.” Students need to know how learning connects to work; they need guidance about middle- and high-skills career pathways. Successful career pathways are not as obvious or clearly demarcated as we assume they are. This is why sites like Pluralsight and Udemy have millions upon millions of users seeking out the extra skills to help them land those first, second, and third jobs.

The first job does not make a career, nor do I mean to imply that workforce training is the end-game for higher education. We can imagine that decades from now, there will inevitably emerge a new set of constraints or new inertia from this particular set of approaches to learning, which will require a new release. Nevertheless, in order to train students to form the habits and skills that lead to a better society, democracy, and citizenry, then we must also acknowledge that students must be connected to the full ecosystem, which includes the workforce and most certainly includes that first job.SNHU Sandbox Collaborative logo.


Michelle R. Weise, Ph.D.
Executive Director, Sandbox ColLABorative
Southern New Hampshire University


“Mind the Gap” Photo Credit: Morgue File.


Categories
Practice

WCET, OLC, & UPCEA Partner on Higher Ed Act for the 21st Century Learner

WCET partners with the Online Learning Consortium (OLC) and the University Professional and Continuing Education Association (UPCEA) in creating a unified voice on pending federal regulations for today’s higher education students.

By working together, we can have more impact on the process. We also avoid having competing priorities or contradictory recommendations. Today, we release a jointly-authored two-page handout focused on issues that we think are essential in addressing the needs of the 21st Century Learner in the upcoming Higher Education Act.Reads "The internet is a necessary component of our personal, educational, and professional lives."

What is the Higher Education Act?

Last year we celebrated the 50th anniversary of the Higher Education Act of 1965. The Act was the beginning of Congress’s attempt to codify the relationships that the federal government has with higher education. Over the years, the rules for institutions to remain eligible to offer federal financial aid have grown. Congress often uses it to impose additional requirements on colleges. Although the Act is expected to be “reauthorized” every five years, the last time such action was taken was 2008.

With the great leadership of Senators Alexander (R-TN) and Murray (D-WA), the Senate Health, Education, Labor, and Pensions (HELP) Committee can build on their initial work last year to “reauthorize” the Act.

And there is hope that this could happen soon. Along with other Committee members, these two Senators have uncharacteristically worked across the aisle. Last year it led to similar reauthorization legislation for the Elementary-Secondary Education Act.

What’s Included in the Handout?

It’s a challenge to communicate complex ideas quickly. Our goal was to make this piece an introduction to the issues that will get the reader to question pre-conceived assumptions.

Reads "1/4 of US students are taking at least one online"
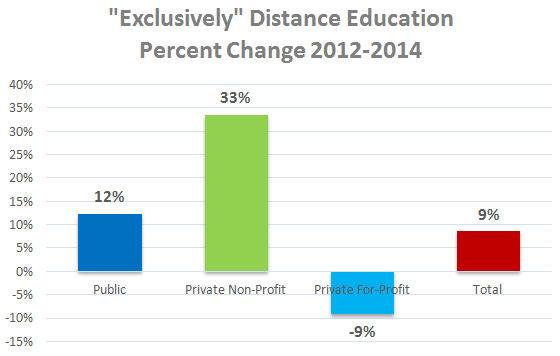
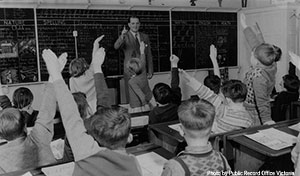
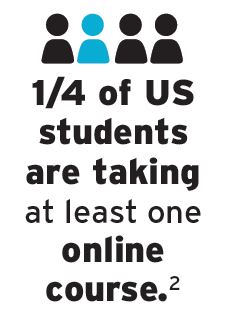
On one side of the handout is a series of infographics highlighting the differences in higher education from 1965 to today. We provide several statistics that show the changed nature of both the learner and the use of educational technologies in shaping the learning experience. It’s important to look beyond online learning to how educational technology is having an impact on teaching in any venue.

On the other side is a list of “Guiding Principles”:

  • Fairness – Do not treat students differently based on mode of instruction.
  • Innovation – Allow greater flexibility for innovations to be introduced.
  • Accountability – Hold colleges to standards of student performance with regulations narrowly tailored to address specific concerns.

The bulleted lists of issues with each principle will be addressed more completely in the future with help from our friend at the Cooley, LLP law firm. Watch for more details on these items.

What’s Next and What Should You Do?

We will share this document with anyone who can help our joint cause.

We will provide additional details on specific issues.

You should use the handout as an informative resource with your government relations staff, Congressional membership, Congressional staffers, or anyone else who can support us.

Finally, thank you to my friends at OLC and UPCEA for partnering. Together, we are stronger!

Russ

Russ Poulin
Director, Policy and Analysis
WCET


If you like what we do, join WCET.


Categories
Uncategorized

Highlights of Distance Education Enrollment Trends from IPEDS Fall 2014

Earlier this month, the U.S. Department of Education’s National Center for Educational Statistics (NCES) released the third year of Integrated Postsecondary Education Data System (IPEDS) data that reports Distance Education (DE) student enrollment for the Fall of 2014. This is the third consecutive year that IPEDS included the enrollments for Distance Education and that WCET has reported on the yearly counts and the year-to-year trends.

For the third year, I am pleased to be working with Terri Taylor Straut who is contracting with WCET to compile the data and perform the analyses with me. This blog post gives you a few highlights of what we have uncovered so far. Early in the new year, we will provide you with data tables and graphics on the most interesting statistics. We will follow that (probably in February) with a deeper dive into the context and interpretations of some data items. For example, we will follow-up with select institutions to see if they still are experiencing some of the problems submitting the IPEDS data as we reported two years ago. 

Meanwhile, here is a little Christmas present for the data geeks out there. Analysis of the sector data reveals that many of the trends we identified in the 2013 data earlier this year continue with the 2014 data. Below are initial observations from Terri.
Russ Poulin, Director Policy & Analysis, WCET

Distance Education Enrollments Continue to Grow, But Vary Greatly by Sector

Enrollments by students Exclusively in Distance Education continued to rise in 2014. There were 2,824,334 fully online enrollments in 2014, compared to 2,659,203 in 2013, representing a 6% increase in just one year. Last year, one-out-of-eight of all higher education students were enrolled exclusively in distance education. In 2014, it is now closer to one-in seven students being enrolled exclusively at a distance.


Graph displaying the following DE enrollments: Exclusively DE: 2012: 2,638,653; 2013: 2,659,203; 2014: 2,824,334. Some but not all ED Enrollments: 2012: 2,806,048; 2013: 2,862,991; 2014: 2,926,083.

DE Enrollments Continue to Grow While Overall Enrollments are Declining

As we noted in our blog about the 2013 data, the distance education growth is in the context of a slight decline in overall enrollments, as reported to IPEDS. This trend continued in 2014. Total enrollments were reported at 20,207,369 in 2014 for all U.S. degree-granting institutions with 2 year or higher degree-granting programs. This represents a small decrease (-0.8%) from 2013 enrollments of 20,375,789. Looking over the three years of reported data, enrollment is down 2.2% from a high in 2012 of 20,642,819.

Distance Education enrollments continued to rise in all categories, during this time of total enrollment decline. Fully Distance Education enrollments are growing at the greatest rate 6.6% in two years and enrollment in ‘Some but not all Distance Education’ grew at 4.1% over the reporting period of 2012 to 2014.

outlines of 7 people one filled in - one-in-seven students is enrolled exclusively at a distance


For-profit Institutions Enroll Less Than a Third of All Exclusively DE Students

Enrollment exclusively in Distance Education continues to vary by sector and the trends we identified in 2013 are also evident in the 2014 data. Public institutions represent 49% of all enrollments with 1,381,897; Private For-Profit institutions represent 30% of enrollments with 838,219; and the Private Non-Profit sector remains the smallest with 604,218 enrollments or 21% of fully online enrollments.

For exclusively DE enrollments; 49% are public, 21% private-non-profit, and 30% were private for-profit institutions.

Public and Private, Non-Profit Institutions Enrolling More DE Students

Now that we have three years of IPEDS data for Distance Education, we can begin to look at trends with more confidence. Comparing 2014 Exclusively DE enrollments to the same sector data from 2012, reveals interesting trends.

Private Non-Profit institutions continue to grow their exclusively DE enrollments at the highest rate, 22% in two years. Public institutions are also growing DE enrollments, but at a lower rate, 9%. However For-Profit institutions have seen an 11% decline in DE enrollments over the same two year period. The average growth in the two year period for all sectors is 6%.

Percent change in DE enrollments from Fall 2012 to 2014: 9% Public, 22% Private non-profit; -11% private for-profit; and 6% increase total.

Institutions Continue to Report That They Don’t Know Where Some of Their Students Are Located

While much of the data represents good news for distance education, there is one troubling trend revealed in our initial analysis, institutions continue to report that they don’t know where some of their students are located. In fact, there is approximately a 5% increase between 2013 and 2014 in Exclusively Distance Education enrollments in the U.S., State Unknown (4.5%) and 5.3% reported Location of Student Unknown/Not Reported.

DE Enrollments Student Location Unknown. Graph show a slight degrease for the "state unkown" category from 2012 to 2013 and stable for 2014. The graph shows growth each year in those reporting "location of student unknown/not reported"

Finally

We have previously reported concerns with the reporting methodology used by many institutions when reporting their DE enrollments to IPEDS, but the IPEDS data is currently the best source or enrollment data. It is possible that the 2014 data is more accurate, as institutions have had more time to refine their reporting.

We will explore this issue, other issues behind the data, and additional statistical analyses when we conduct deeper research early in 2016.

Merry Christmas. Happy holidays. Happy New Year.Terri Straut

Terri Taylor Straut
Ascension Consulting


With help from….

Photo of Russ Poulin with a bat.

Russ Poulin
Director, Policy and Analysis
WCET


If you like our work, join WCET!