Highlights of Distance Education Enrollment Trends from IPEDS Fall 2014
Published by: WCET | 12/21/2015
Tags: Distance Education, Forprofit Universities, IPEDS, State Authorization, Survey, U.S. Department Of Education
Published by: WCET | 12/21/2015
Tags: Distance Education, Forprofit Universities, IPEDS, State Authorization, Survey, U.S. Department Of Education
Earlier this month, the U.S. Department of Education’s National Center for Educational Statistics (NCES) released the third year of Integrated Postsecondary Education Data System (IPEDS) data that reports Distance Education (DE) student enrollment for the Fall of 2014. This is the third consecutive year that IPEDS included the enrollments for Distance Education and that WCET has reported on the yearly counts and the year-to-year trends.
For the third year, I am pleased to be working with Terri Taylor Straut who is contracting with WCET to compile the data and perform the analyses with me. This blog post gives you a few highlights of what we have uncovered so far. Early in the new year, we will provide you with data tables and graphics on the most interesting statistics. We will follow that (probably in February) with a deeper dive into the context and interpretations of some data items. For example, we will follow-up with select institutions to see if they still are experiencing some of the problems submitting the IPEDS data as we reported two years ago.
Meanwhile, here is a little Christmas present for the data geeks out there. Analysis of the sector data reveals that many of the trends we identified in the 2013 data earlier this year continue with the 2014 data. Below are initial observations from Terri.
Russ Poulin, Director Policy & Analysis, WCET
Distance Education Enrollments Continue to Grow, But Vary Greatly by Sector
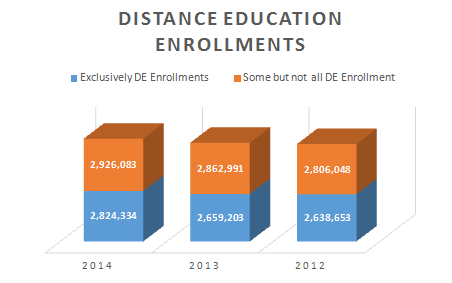
Enrollments by students Exclusively in Distance Education continued to rise in 2014. There were 2,824,334 fully online enrollments in 2014, compared to 2,659,203 in 2013, representing a 6% increase in just one year. Last year, one-out-of-eight of all higher education students were enrolled exclusively in distance education. In 2014, it is now closer to one-in seven students being enrolled exclusively at a distance.

DE Enrollments Continue to Grow While Overall Enrollments are Declining
As we noted in our blog about the 2013 data, the distance education growth is in the context of a slight decline in overall enrollments, as reported to IPEDS. This trend continued in 2014. Total enrollments were reported at 20,207,369 in 2014 for all U.S. degree-granting institutions with 2 year or higher degree-granting programs. This represents a small decrease (-0.8%) from 2013 enrollments of 20,375,789. Looking over the three years of reported data, enrollment is down 2.2% from a high in 2012 of 20,642,819.
Distance Education enrollments continued to rise in all categories, during this time of total enrollment decline. Fully Distance Education enrollments are growing at the greatest rate 6.6% in two years and enrollment in ‘Some but not all Distance Education’ grew at 4.1% over the reporting period of 2012 to 2014.

For-profit Institutions Enroll Less Than a Third of All Exclusively DE Students
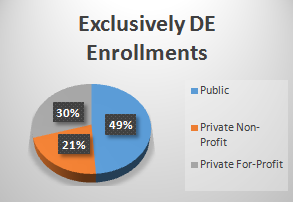
Enrollment exclusively in Distance Education continues to vary by sector and the trends we identified in 2013 are also evident in the 2014 data. Public institutions represent 49% of all enrollments with 1,381,897; Private For-Profit institutions represent 30% of enrollments with 838,219; and the Private Non-Profit sector remains the smallest with 604,218 enrollments or 21% of fully online enrollments.

Public and Private, Non-Profit Institutions Enrolling More DE Students
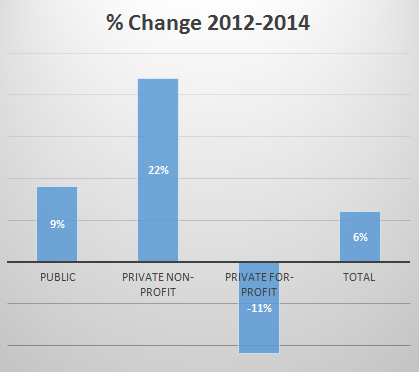
Now that we have three years of IPEDS data for Distance Education, we can begin to look at trends with more confidence. Comparing 2014 Exclusively DE enrollments to the same sector data from 2012, reveals interesting trends.
Private Non-Profit institutions continue to grow their exclusively DE enrollments at the highest rate, 22% in two years. Public institutions are also growing DE enrollments, but at a lower rate, 9%. However For-Profit institutions have seen an 11% decline in DE enrollments over the same two year period. The average growth in the two year period for all sectors is 6%.

Institutions Continue to Report That They Don’t Know Where Some of Their Students Are Located
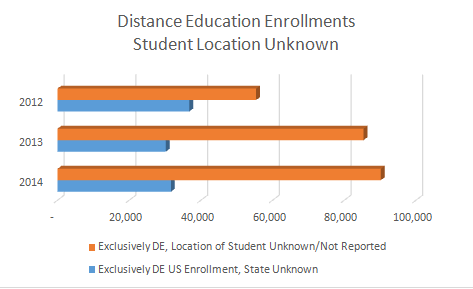
While much of the data represents good news for distance education, there is one troubling trend revealed in our initial analysis, institutions continue to report that they don’t know where some of their students are located. In fact, there is approximately a 5% increase between 2013 and 2014 in Exclusively Distance Education enrollments in the U.S., State Unknown (4.5%) and 5.3% reported Location of Student Unknown/Not Reported.

Finally
We have previously reported concerns with the reporting methodology used by many institutions when reporting their DE enrollments to IPEDS, but the IPEDS data is currently the best source or enrollment data. It is possible that the 2014 data is more accurate, as institutions have had more time to refine their reporting.
We will explore this issue, other issues behind the data, and additional statistical analyses when we conduct deeper research early in 2016.
Merry Christmas. Happy holidays. Happy New Year.
Terri Taylor Straut
Ascension Consulting
With help from….

Russ Poulin
Director, Policy and Analysis
WCET
If you like our work, join WCET!
11 replies on “Highlights of Distance Education Enrollment Trends from IPEDS Fall 2014”
I suspect that the uptick in reports of students in unknown locations results from institutions getting a better handle on their own details.
Q: Are students in unknown locations eligible for Title IV aid? I don’t see how they could be.
Alan –
We hope so. With that statistic, as with several others, we are curious about the story behind the numbers. We will continue to do some checking and provide some deeper analysis in coming weeks. If it is the same group of institutions that can’t report this data, then that is more alarming.
Those students are totally eligible for Title IV aid. Since the federal regulation (Chapter 34, 600.9(c)) was vacated, the Department can not enforce the requirement that institutions be in compliance with state authorization laws. And the first step in compliance is knowing where your students are located.
Russ
Thanks Russ. I wondered how the institution knows that the student is eligible for Title IV when they don’t even know if the student is in the US. Or do they know that? How can they know WHO the student is if they don’t know WHERE the student is? A student without an address could be in Belgium or Panama, and I don’t think foreign students are automatically Title IV eligible, right? I would think that the opportunity for fraud would be considerable when an institution can’t identify its students.
[…] rate than higher education overall – the IPEDS data release recently for Fall 2014 indicated that overall enrollments in colleges and universities were down 2.2% over the previous 2 years. However, online learning enrollments continued to grow, with a 6.6% increase in enrollments over […]
[…] T.T. and Poulin, R. (2015) Highlights of Distance Education Trends from IPEDS Fall 2014, WCET Frontiers, 21 […]
[…] this week,WICHE Cooperative for Educational Technologies released their third annual report of NCES data on distance education student enrollment for the fall of 2014. WCET plans to continue […]
In regards to the Title IV issue, to be eligible for federal student aid students don’t need to live in the US, but they need to be citizens or a certain type of eligible non-citizen (a super restricted group that is tough to qualify for in general.) When a student files a FAFSA, data checks are conducted with the Department of Homeland Security and other agencies which confirm citizenship status. For this reason, I would say citizenship status matters more than where the student is geographically located.
There is also the question of whether the college is eligible for Title IV participation. In the U.S. about 80-85% of degree-granting institutions are eligible, but there are also some nondomestic institutions that a student can attend using Title IV aid if the feds have approved the school.
[…] We reported some preliminary results in December. Any differences should be due to the changes that we made in harmonizing our data set […]
[…] WCET’s initial analysis of Fall 2014 data […]
[…] WCET’s initial analysis of Fall 2014 data […]